
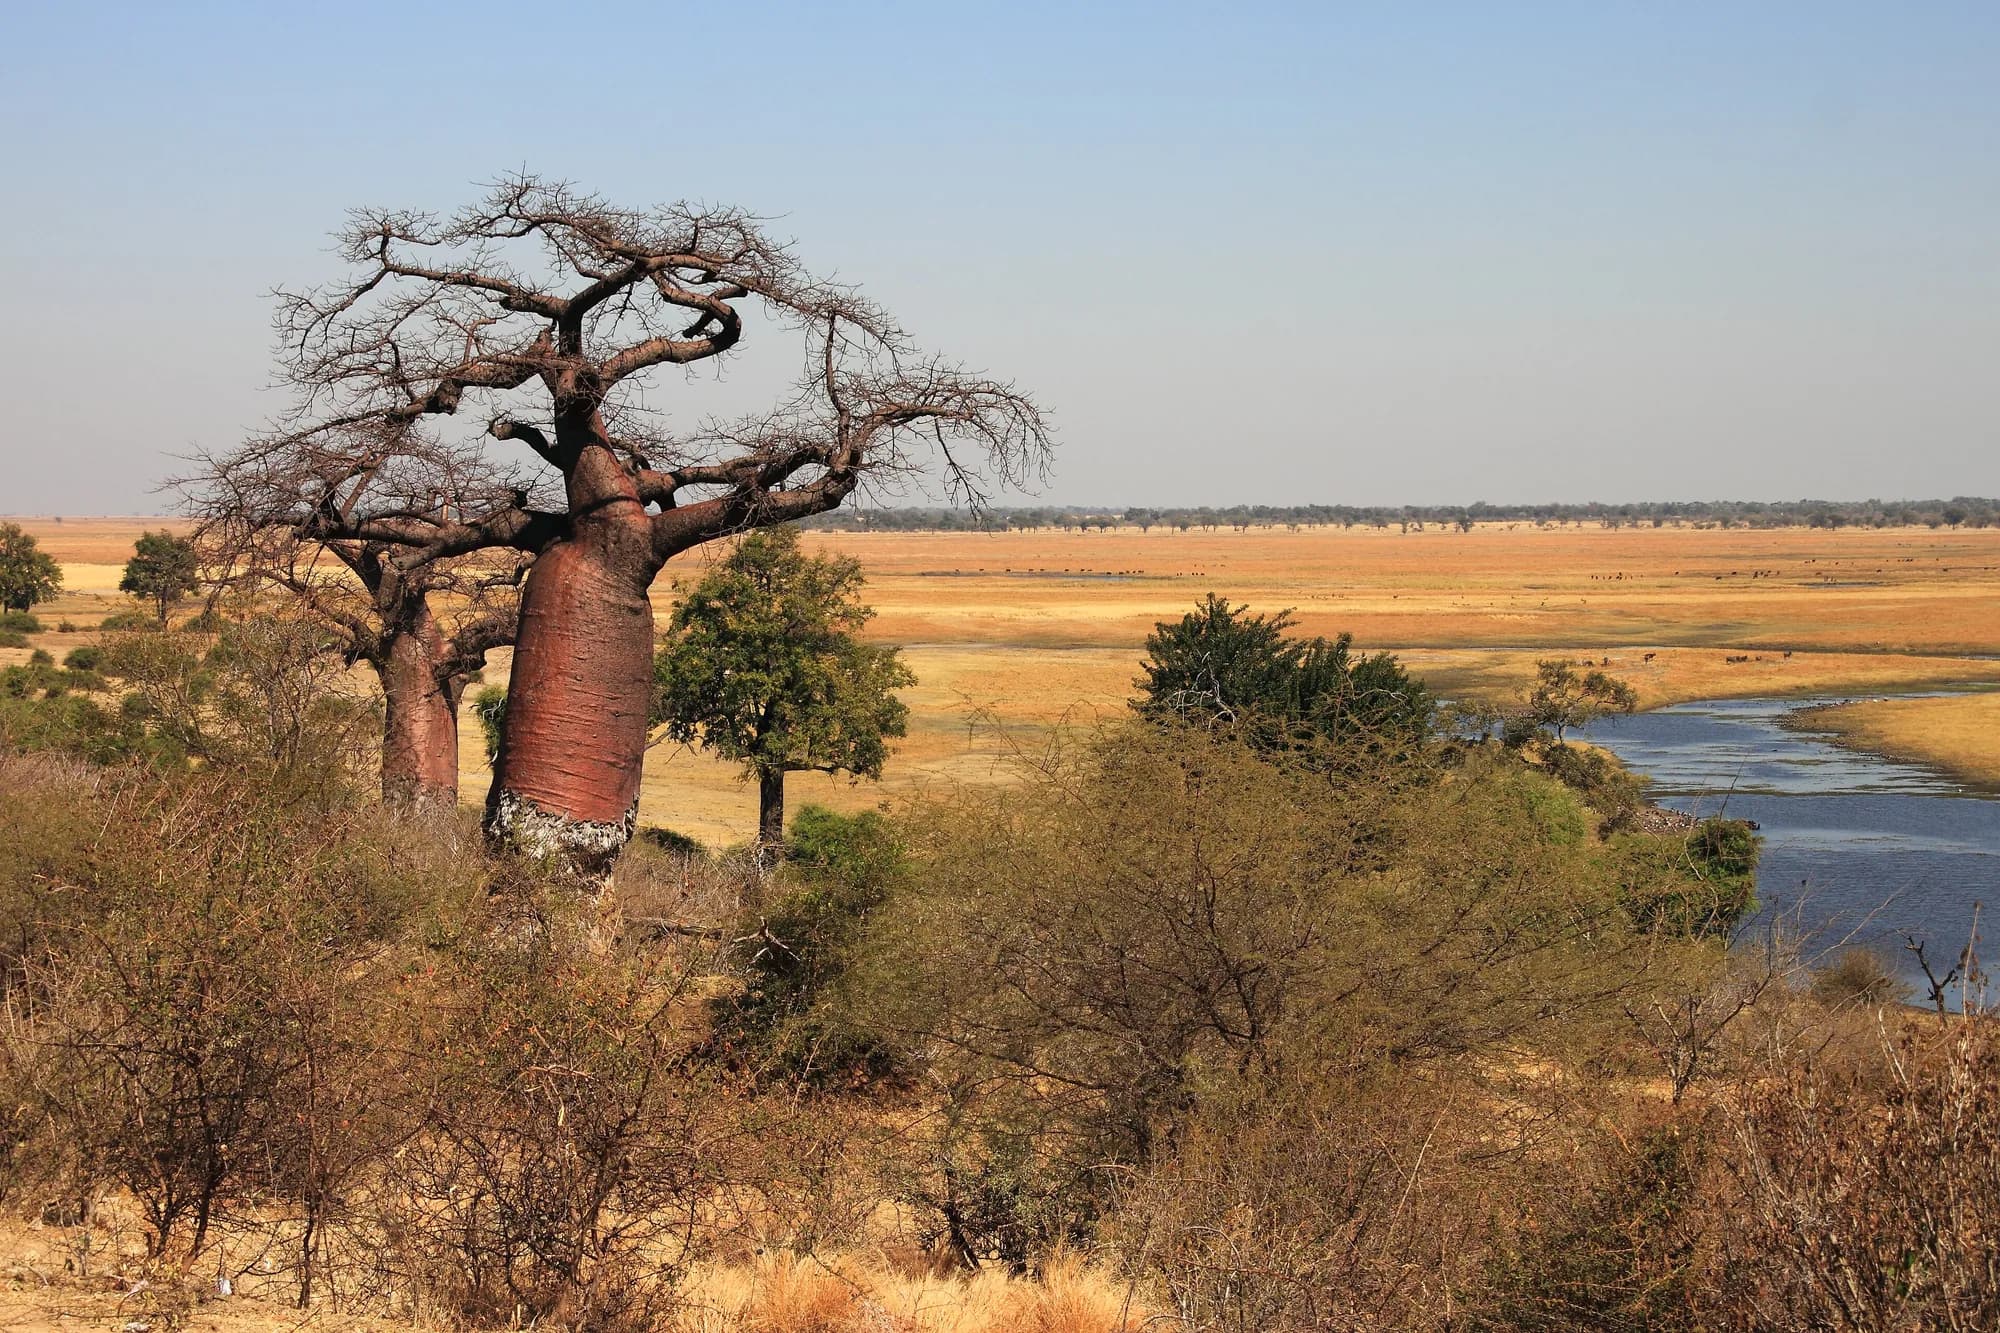
Botswana / Chobe / Sightings log — Chobe
Sightings log — Chobe
On the Chobe riverfront in the late dry season the sighting question is not whether you will see elephant. It is what else is in the frame, and how much of the rest of the park you are prepared to drive for.
The riverfront from the water, in the order you meet it
A Chobe cruise is an unusual sighting environment and it changes what you see. You are lower than the animals, quieter than a vehicle, moving along a single edge that everything has to come to, and the light comes off the water. Elephants that would move away from a Land Cruiser will walk into the shallows in front of a drifting boat.
- Elephant, in numbers, drinking and crossing. The survey's riverfront stratum estimate of about 7,072 animals over roughly 1,520 square kilometres was flown on 1 October, at the peak of the concentration.
- Hippo, continuously. The survey estimated 8,649 hippo across Botswana's KAZA portion, though its riverfront figure carries a confidence interval too wide to quote and aerial counts miss submerged animals.
- Crocodile on the sandbanks. Nobody counts them — crocodiles are not a survey species and we found no published Chobe estimate — so this one is qualitative and honest about it.
- Buffalo on the floodplain in the dry months, in herds that move between the water and the tree line.
- Puku, if you are looking for them. This is the only stretch of river in Botswana where they occur, and they stay on the open floodplain near water.
- Waterbirds throughout. The recent DWNP and BUAN count logged 82 waterbird species along the river between 2019 and 2025, with no significant seasonal difference in diversity.
The thing people underestimate
The boat is not a compromise for people who do not want a game drive. On the riverfront in the dry season it is the better vehicle. A drive on the floodplain track gives you the same animals from further away and through dust; the boat gives you the waterline, which is where they all are. If you are choosing one activity at Chobe, choose the boat.
KAZA Elephant Survey 2022, Volume II: stratum results
Read 28 September 2026. The volume that carries results stratum by stratum. Source for the Chobe River North-East Botswana stratum — 1,519.74 square kilometres, flown in a single four-hour flight on 1 October 2022 from Kasane, 7,072 elephants with a 95 per cent interval of 4,022 to 10,122 and a density of 4.653 per square kilometre — and for the Nogatsaa, Savuti North, Savuti Marsh and Savuti East strata quoted here. Survey strata are not park boundaries and the volume publishes no Chobe National Park total; we have not added strata together to make one.
https://kavangozambezi.org/wp-content/uploads/2024/11/KAZA-Elephant-Survey-Volume-II-part-1.pdfDipheko, Sianga, Shabane, Seonyatseng et al. — 'Diversity of Waterbirds in Chobe River, Botswana', Journal of Sustainable Development 18(4), published 1 July 2025
Read 28 September 2026. Eight ground counts made from vehicles in wet and dry seasons between 2019 and 2025, by authors from the Department of Wildlife and National Parks at Kasane and the Botswana University of Agriculture and Natural Resources. It records a total of 82 waterbird species along the Chobe River over that period and finds no significant seasonal or year-to-year difference in the diversity index. Waterbirds only, and the only recent primary Chobe bird count we found.
https://doi.org/10.5539/jsd.v18n4p106O'Shaughnessy, Cain & Owen-Smith — 'Comparative diet and habitat selection of puku and lechwe in northern Botswana', Journal of Mammalogy 95(5), 2014
Read 28 September 2026 (abstract, via the OpenAlex index). Source for the statement that in Botswana puku are restricted to a narrow band of floodplains along the Chobe River, whereas lechwe are far more abundant across the Chobe riverfront, the Linyanti swamps, the Kwando and the Okavango. Earlier work by Dipotso and Skarpe (2006), from fieldwork in 2001 to 2003, found puku strongly increased on the 1960s but concluded the population remains small, isolated and vulnerable, with 91 per cent of sightings in floodplain habitat.
https://doi.org/10.1644/13-MAMM-A-301Why the concentration builds, and what that means month by month
The riverfront spectacle is a water story, and the mechanism is measurable. A peer-reviewed study of elephant distribution in the park found dry-season elephant biomass at seven livestock standard units per square kilometre across Chobe as a whole, rising to thirteen within five kilometres of the Chobe River. The river roughly doubles the density around it, and it does so because by September there is very little else.
The sighting year on the riverfront, as the water dictates it
| Period | Where the animals are | What it does to sightings |
|---|---|---|
| Late dry, roughly August to early November | Pulled hard onto the river, because the interior pans have gone | The densest concentration of the year, and the reason the cruise is famous |
| First rains, roughly November to December | Beginning to disperse inland as pans fill | Numbers on the river fall away quickly once the interior holds water |
| Wet, roughly January to March | Spread across the interior and the pans | Fewer elephant on the river, greener, better birding, and far fewer people |
| Early dry, roughly April to July | Returning to permanent water as the pans dry | Building through the period; July is already good and much less crowded than September |
The mechanism is sourced; the month boundaries are our summary of it rather than a published calendar, and they move with the rains. We have not found a DWNP seasonality statement for Chobe, because we have not found a DWNP publication of any kind.
The exception the research found
The waterbird study found no significant seasonal difference in diversity on the river between 2019 and 2025. So the wet season is the poor relation for elephant density and is not the poor relation for birds. If your trip is driven by birding rather than by elephant, the crowded expensive months are not the ones you need.
Fox & Alexander — 'Spatial Distribution and Population Densities of Elephants in a Semi-Arid Savanna', PLoS ONE, 13 October 2015
Read 28 September 2026. Peer-reviewed, and the source for the statement that Chobe National Park provides critical habitat for the largest elephant population in Africa and that elephant numbers in the park have grown at a mean annual rate of between 5.5 and 7 per cent over the past forty years. Its density figures are given in livestock standard units per square kilometre, not elephants per square kilometre — seven LSU per square kilometre across the park, rising to thirteen within five kilometres of the Chobe River — and we quote them only as the ratio between the two, which is the point. The same paper is also the source for the hydrology quoted here: the Chobe widens as it flows east through the park before narrowing and deepening across the Mambova fault to join the Zambezi, and during the annual flood water builds up behind that fault line and spreads outwards across the floodplain, reaching as far upstream as Lake Liambezi in high flood years.
https://journals.plos.org/plosone/article?id=10.1371/journal.pone.0139936Dipheko, Sianga, Shabane, Seonyatseng et al. — 'Diversity of Waterbirds in Chobe River, Botswana', Journal of Sustainable Development 18(4), published 1 July 2025
Read 28 September 2026. Eight ground counts made from vehicles in wet and dry seasons between 2019 and 2025, by authors from the Department of Wildlife and National Parks at Kasane and the Botswana University of Agriculture and Natural Resources. It records a total of 82 waterbird species along the Chobe River over that period and finds no significant seasonal or year-to-year difference in the diversity index. Waterbirds only, and the only recent primary Chobe bird count we found.
https://doi.org/10.5539/jsd.v18n4p106Savuti — the best predator odds in the park, and an honest caveat
Savuti is where people go for cats, and it has the documentation to justify it. The peer-reviewed record of Savuti lions preying on elephant in the late dry season, at a rate of one elephant every three days for a pride of thirty, is one of the more remarkable pieces of predator behaviour recorded anywhere in Africa. It is also twenty-year-old fieldwork on a particular pride, and it is not a forecast.
What Savuti is likely to give you, and how confident to be
| Sighting | Odds, honestly | Why |
|---|---|---|
| Lion | Good in the late dry season | The area is known for prides and the dry season concentrates everything around what water there is |
| Lion hunting elephant | Low, and nobody should sell it to you | Documented behaviour over 1985 to 2005, seasonal, and dependent on which pride is where |
| Elephant | Good | Savuti North was estimated at 5,705 elephants in October 2022, Savuti Marsh at 2,425 |
| Large buffalo herds | Unreliable on recent data | 773 counted in Savuti North with a very wide interval, and none in the Marsh or East strata on the days flown |
| Spotted hyaena, leopard, wild dog | Possible, and we will not put a number on it | No Chobe-specific published estimate exists for any of the three that we could obtain |
The elephant and buffalo rows come from the 2022 aerial survey's stratum tables. The predator rows do not, because predators are not what that survey counts. Where we have no figure we say so rather than estimate.
Power & Compion — 'Lion Predation on Elephants in the Savuti, Chobe National Park, Botswana', African Zoology 44(1), 2009
Read 28 September 2026. The peer-reviewed account of the Savuti lions hunting elephant. It reports that Botswana's Savuti lions switch to preying on elephants during the late dry season from August to November, that the frequency of this increased over 1985 to 2005, that a pride of thirty lions killed one elephant every three days, and that seven of eight elephants killed were aged between four and eleven. It attributes the behaviour to reduced conventional prey during the annual migration and to artificial water making the elephant population more sedentary.
https://doi.org/10.3377/004.044.0104KAZA Elephant Survey 2022, Volume II: stratum results
Read 28 September 2026. The volume that carries results stratum by stratum. Source for the Chobe River North-East Botswana stratum — 1,519.74 square kilometres, flown in a single four-hour flight on 1 October 2022 from Kasane, 7,072 elephants with a 95 per cent interval of 4,022 to 10,122 and a density of 4.653 per square kilometre — and for the Nogatsaa, Savuti North, Savuti Marsh and Savuti East strata quoted here. Survey strata are not park boundaries and the volume publishes no Chobe National Park total; we have not added strata together to make one.
https://kavangozambezi.org/wp-content/uploads/2024/11/KAZA-Elephant-Survey-Volume-II-part-1.pdfWhat Botswana's own wildlife numbers show about Chobe district
Statistics Botswana's environmental indicators, published in August 2026 and sourced throughout to DWNP, carry district tables that nobody quotes. They are not sighting data, but they are the closest thing to an official account of what is happening to wildlife in the Chobe district, and two of the trends are striking.
Chobe district, problem animal incidents, 2020 to 2024
| Species | 2020 | 2021 | 2022 | 2023 | 2024 | Total |
|---|---|---|---|---|---|---|
| Elephant | 184 | 203 | 104 | 126 | 24 | 641 |
| Lion | 94 | 112 | 37 | 38 | 28 | 309 |
| Buffalo | 38 | 0 | 10 | 9 | 2 | 59 |
| Eland | 14 | 15 | 6 | 6 | 17 | 58 |
| All species | 370 | 368 | 169 | 206 | 84 | 1,197 |
Incidents recorded across Chobe district, not inside the park. The national total fell 47 per cent between 2020 and 2024; Chobe district's fell by 77 per cent over the same period, which is a far sharper drop than the country as a whole and is not explained anywhere in the report.
Chobe district, recorded wildlife mortality, 2019 to 2024
| Species | 2019 | 2020 | 2021 | 2022 | 2023 | 2024 |
|---|---|---|---|---|---|---|
| Eland | 1 | 8 | 5 | 2 | 0 | 26 |
| Elephant | 0 | 0 | 0 | 0 | 1 | 15 |
| Baboon | 29 | 23 | 6 | 11 | 38 | 14 |
| Buffalo | 8 | 2 | 6 | 16 | 14 | 2 |
| All species | 83 | 63 | 118 | 90 | 98 | 72 |
Recorded mortality, which means deaths that came to the department's attention rather than all deaths. The 2024 jump in eland and elephant is the notable feature and the report does not explain it.
Why a sightings page carries a mortality table
Because it is the only official, current, downloadable dataset about Chobe wildlife there is, and because the two tables together say something useful: elephant and lion dominate the human-wildlife interface here, buffalo are a smaller factor than their reputation suggests, and the department is recording and publishing — just not through a website of its own.
Statistics Botswana — Botswana Selected Environmental Indicators 2024 (published August 2026)
Read 28 September 2026. The fourth edition in the national five-yearly environmental statistics series, ISBN 978-99968-81-82-4, published August 2026, with the wildlife chapter sourced throughout to the Department of Wildlife and National Parks. It carries district-level tables for Chobe on poaching, problem-animal incidents and wildlife mortality. It is the one current, downloadable, government-published dataset on Chobe wildlife we found, and it is worth noting that DWNP data reaches the public through the statistics office rather than through DWNP.
https://www.statsbots.org.bw/sites/default/files/Botswana%20Selected%20Environmental%20Indicators%202024.pdfThe species you should not build a trip around
Being clear about the gaps is more useful than a long list of everything that has ever been recorded. On the evidence we could reach, these are the ones where expectation and data part company.
- Sable and roan at Nogatsaa. Across 3,091 square kilometres flown on 10 September 2022 the survey saw one roan and no sable. Botswana's KAZA portion holds an estimated 3,901 sable, so the animals exist; the reliable Nogatsaa sighting is the part that is not supported.
- Chobe bushbuck. About 39 animals along roughly 50 km of riverfront on the only objective estimate ever made. A sighting is a genuine event, not a box to tick.
- Puku in numbers. The only Botswana population, a narrow band of floodplain, and described in the literature as small, isolated and vulnerable.
- Wild dog. We found no Chobe-specific published estimate at all. The species is present in the wider Kwando-Linyanti system and the concessions west of the park are the better bet; inside Chobe National Park we have no figure to offer.
- Big buffalo herds in Savuti. Reputation says yes; the 2022 counts in the Marsh and East strata say none seen on the days flown.
Where to go instead, for two of these
If wild dog is the trip, Moremi and the Kwando-Linyanti concessions west of the park are where the species is associated in the literature, and Moremi is the park this site lists wild dog against. If sable and roan are the trip, they are a Zimbabwe and Zambia proposition more than a Chobe one. Chobe is an elephant-and-river park with very good lions at Savuti, and it is best chosen for that rather than defended for everything else.
KAZA Elephant Survey 2022, Volume II: stratum results
Read 28 September 2026. The volume that carries results stratum by stratum. Source for the Chobe River North-East Botswana stratum — 1,519.74 square kilometres, flown in a single four-hour flight on 1 October 2022 from Kasane, 7,072 elephants with a 95 per cent interval of 4,022 to 10,122 and a density of 4.653 per square kilometre — and for the Nogatsaa, Savuti North, Savuti Marsh and Savuti East strata quoted here. Survey strata are not park boundaries and the volume publishes no Chobe National Park total; we have not added strata together to make one.
https://kavangozambezi.org/wp-content/uploads/2024/11/KAZA-Elephant-Survey-Volume-II-part-1.pdfDipotso, Skarpe, Kelaeditse & Ramotadima — 'Chobe bushbuck in an elephant-impacted habitat along the Chobe River', African Zoology 42(2), 2007
Read 28 September 2026. A capture-recapture estimate from road counts along about 50 km of riverfront inside the park, putting the bushbuck population at 39 animals with a standard deviation of 7.47 — the authors say it is the first objective estimate for the area. They record evidence that the population was low around 1900, peaked in the 1960s and declined to the 1990s, with no further decline between 1991 and their study.
https://doi.org/10.3377/1562-7020(2007)42[261:CBIAEH]2.0.CO;2Reading the woodland, which is a sighting in itself
The dead and broken trees along the Chobe and Linyanti banks are the most visible thing on a cruise after the animals, and they are the subject of a substantial research literature rather than a sign of neglect. Knowing what you are looking at turns a slightly bleak view into the most interesting thing on the water.
- The riparian canopy along the Linyanti has changed composition over more than two decades, from initial dominance by two Acacia species to those species making up less than 5 per cent of the canopy, with dead trees strongly associated with severe elephant damage — bark stripping and felling.
- The pattern is not simply worst at the water. At landscape scale debarking falls with distance from the river while branch herbivory rises, except in the first ten kilometres where most earlier work had looked. So the damage you see from a boat is not representative of the park.
- Standing dead trees along the Savuti channel are a different story again: they grew while the channel was dry and drowned when it flowed. Those are drowned trees, not elephant-killed ones, and telling the two apart is a satisfying thing to be able to do.
A question worth asking your guide
Ask which of the dead trees on this stretch are elephant work and which are water. A guide who can answer that has been on the river a while, and it is a better test than any number of species names.
Botswana Tourism Organisation — Savuti and Linyanti
Read 28 September 2026. Source for the Savuti channel running about 100 km from the Linyanti River into the Savuti Marsh and on towards the Mababe Depression, which the page says is fed by the Ngwezumba River from the north-east; for the statement that the channel has inexplicably dried up and recommenced its flow several times over the past hundred years, which the page attributes to plate tectonics; and for the dead trees left standing along it. Also the source for the Linyanti concession being about 1,250 square kilometres.
https://botswanatourism.co.bw/explore/savuti-and-linyantiTeren, Owen-Smith & Erasmus — 'Elephant-mediated compositional changes in riparian canopy trees over more than two decades in northern Botswana', Journal of Vegetation Science 29(4), 2018
Read 28 September 2026 (abstract, via Crossref). Source for the finding that the composition of riparian canopy trees changed from initial dominance by two Acacia species to those two species forming less than 5 per cent of the woodland canopy, and that dead trees were strongly associated with severe damage inflicted by elephants including bark stripping and felling. The fieldwork is on the Linyanti River rather than the Chobe riverfront, which is worth saying when the same view is pointed out from a boat below Kasane.
https://doi.org/10.1111/jvs.12638Fullman & Child — 'Water distribution at local and landscape scales affects tree utilization by elephants in Chobe National Park, Botswana', African Journal of Ecology 51, 2013
Read 28 September 2026 (abstract, via Crossref). Source for the finding that at a local scale branch herbivory decreases with distance from water while debarking first decreases and then increases again, and that at a landscape scale debarking decreases with distance from the river but branch herbivory increases, except within the first ten kilometres where previous studies had focused. Also worth naming because it is the paper a widely repeated claim that Chobe has the highest elephant density on the planet is cited to, and it contains no such comparison.
https://doi.org/10.1111/aje.12026