
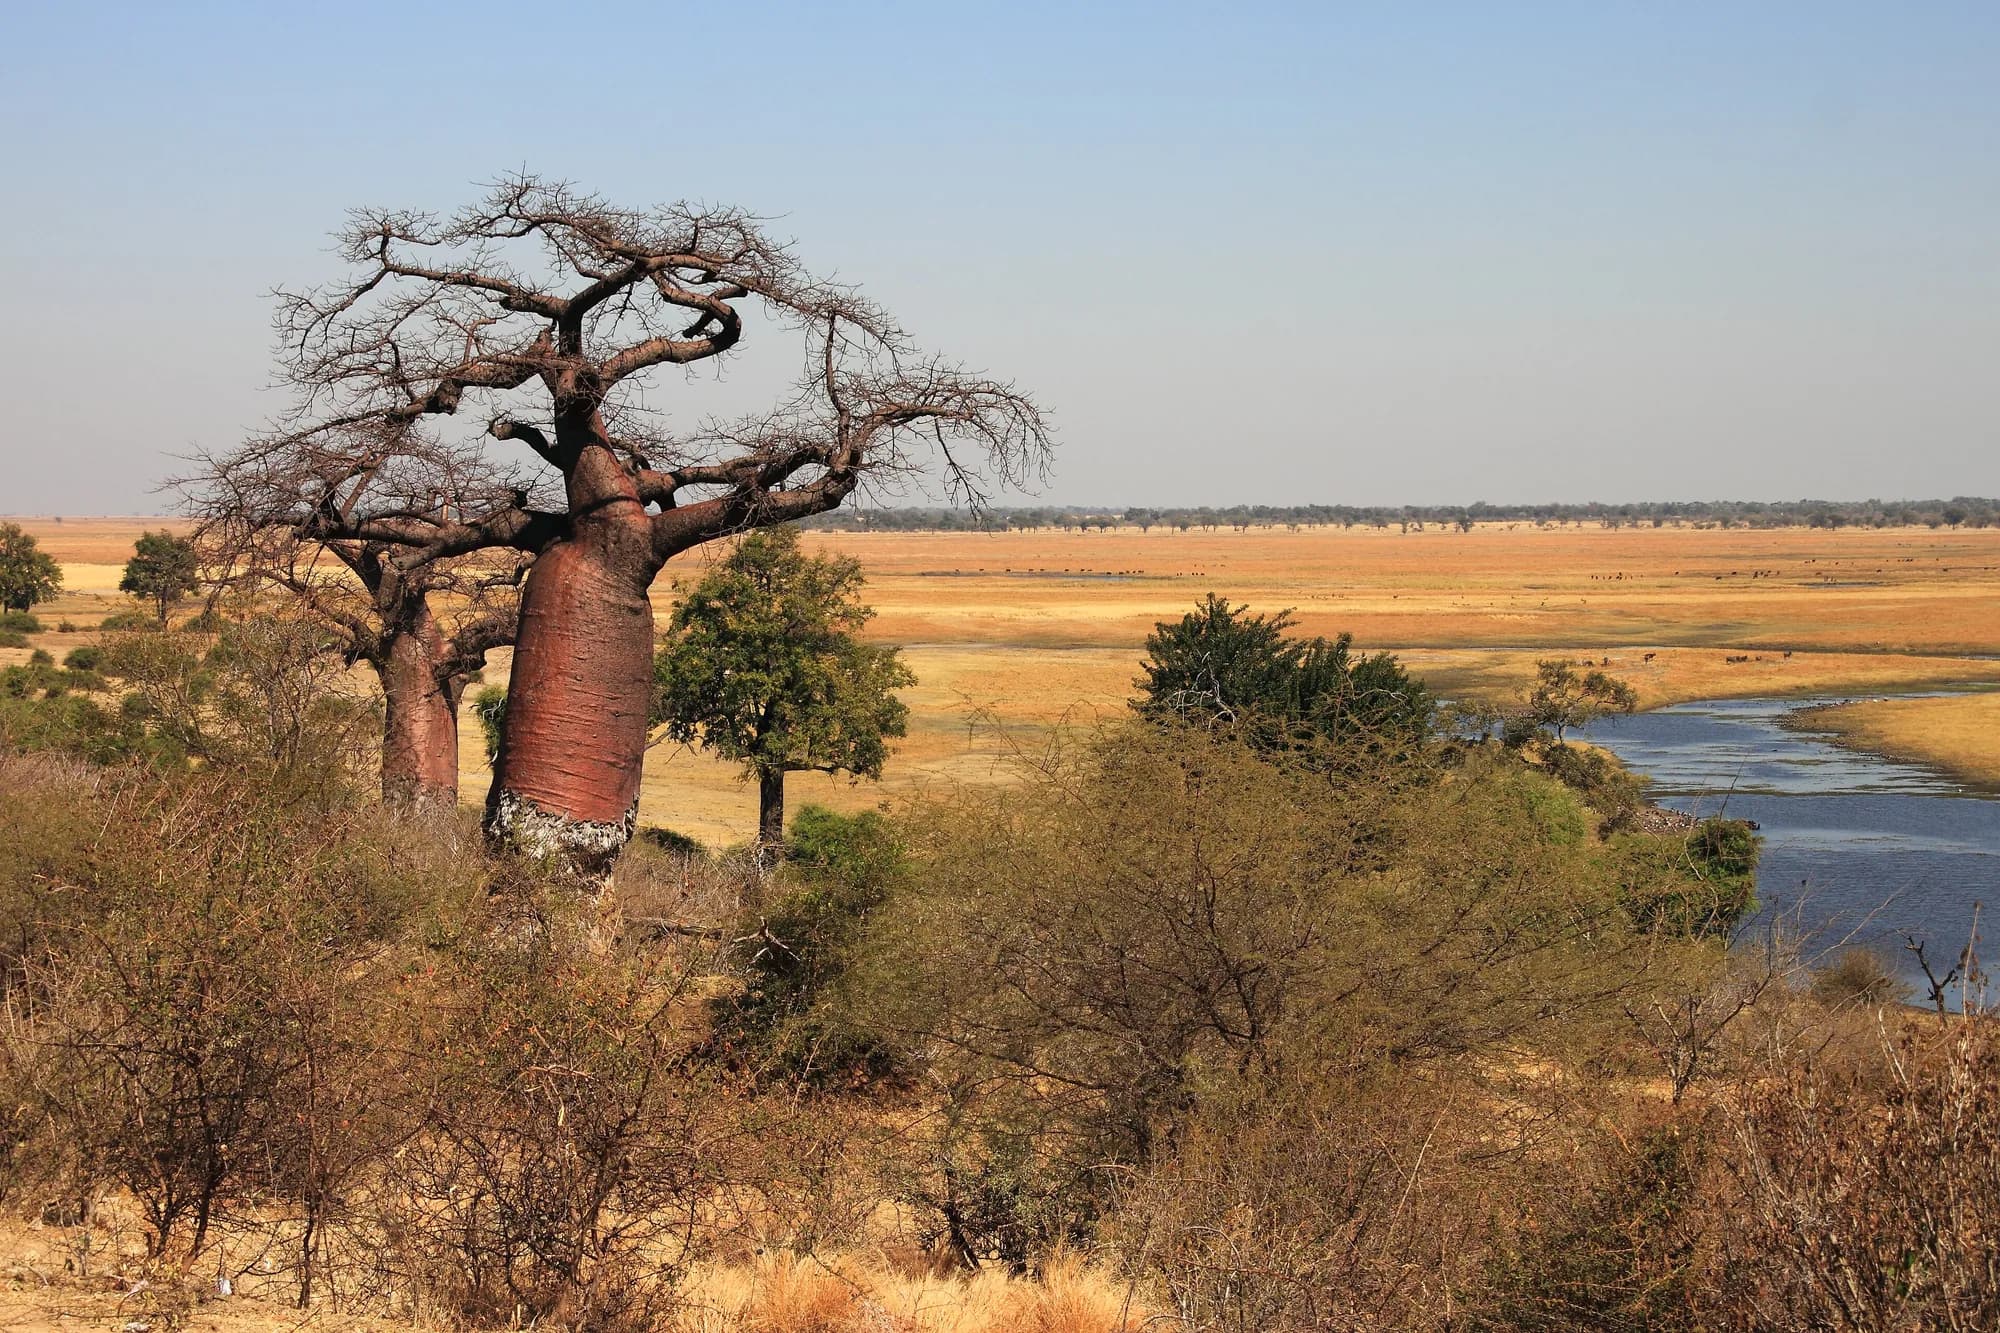
Botswana / Chobe / Wildlife — Chobe
Wildlife — Chobe
Chobe's wildlife is better documented than almost any park in this region and worse described than most, because the numbers people repeat about it are not the numbers anyone counted.
The elephants, and what was actually counted
The KAZA Elephant Survey 2022 is the authoritative count for this landscape. It flew 2,404 transects over 310,865 square kilometres between 22 August and 28 October 2022, to CITES MIKE standards, and it published its results stratum by stratum. Botswana's surveyed portion of KAZA holds 131,909 elephants, with a 95 per cent confidence interval of 119,976 to 143,842. That is a landscape figure, and the survey itself warns that it covers only the KAZA portion of the country, not Botswana.
There is no Chobe National Park stratum. The survey divides the landscape into 179 strata whose boundaries were drawn for counting, not for administration, and none of them is the park. The stratum that matters for a visitor is the one along the water, and it was flown in a single four-hour flight out of Kasane on 1 October 2022 — close to the peak of the dry season, which is the best possible timing for this particular question.
KAZA Elephant Survey 2022, the strata in and around Chobe
| Stratum | Area | Flown | Elephants | 95% interval | Density per km2 |
|---|---|---|---|---|---|
| Chobe River NE Botswana | 1,520 km2 | 1 October 2022 | 7,072 | 4,022 to 10,122 | 4.65 |
| Savuti North | 1,914 km2 | 4 October 2022 | 5,705 | 2,263 to 9,146 | 2.98 |
| Nogatsaa | 3,091 km2 | 10 September 2022 | 5,853 | 1,605 to 10,102 | 1.89 |
| Savuti Marsh | 2,128 km2 | 30 September 2022 | 2,425 | 291 to 4,559 | 1.14 |
| Savuti East | 834 km2 | 30 September 2022 | 1,848 | 127 to 3,570 | 2.22 |
Do not add these up. The strata do not tile the park, one of them overlaps a transfrontier stratum covering the same elephants on the Namibian floodplain, and the survey publishes no valid combined interval for such a sum. Note also how wide the individual intervals are — Savuti Marsh is somewhere between 291 and 4,559 elephants, which is an honest expression of what a one-day aerial sample count over 2,128 square kilometres can tell you.
The riverfront number in plain terms
About seven thousand elephants on a strip of about 1,520 square kilometres along the Chobe River at the start of October, or roughly one elephant for every 21 hectares. That is an extraordinary concentration and it is the reason to come. It is not tens of thousands, and anyone telling you it is has not read the survey.
Bussiere & Potgieter — KAZA Elephant Survey 2022, Volume I: Results and Technical Report (KAZA TFCA Secretariat, Kasane, 2023)
Read 28 September 2026. The survey report itself, not reporting about it. A systematic transect aerial sample count flown 22 August to 28 October 2022 to CITES MIKE aerial survey standards, covering 310,865 square kilometres — 60 per cent of the 519,912 square kilometre KAZA transfrontier area — in 195 flights and 2,404 transects. It gives 227,900 elephants for KAZA with a 95 per cent confidence interval of 211,157 to 244,643, and 131,909 for Botswana's surveyed portion with an interval of 119,976 to 143,842 at a density of 1.067 per square kilometre. The report states explicitly that a country result represents only the surveyed portion of KAZA within that country, not the whole country.
https://kavangozambezi.org/wp-content/uploads/2024/11/1.-KAZA-Elephant-Survey_Volume-I.pdfKAZA Elephant Survey 2022, Volume II: stratum results
Read 28 September 2026. The volume that carries results stratum by stratum. Source for the Chobe River North-East Botswana stratum — 1,519.74 square kilometres, flown in a single four-hour flight on 1 October 2022 from Kasane, 7,072 elephants with a 95 per cent interval of 4,022 to 10,122 and a density of 4.653 per square kilometre — and for the Nogatsaa, Savuti North, Savuti Marsh and Savuti East strata quoted here. Survey strata are not park boundaries and the volume publishes no Chobe National Park total; we have not added strata together to make one.
https://kavangozambezi.org/wp-content/uploads/2024/11/KAZA-Elephant-Survey-Volume-II-part-1.pdfThe densest elephant concentration in Africa? We checked, and no
This is the sentence that sells Chobe, it appears on this site's own park card, and it does not survive contact with the survey data. It is worth setting out where it came from, because the trail is instructive about how a tourism superlative becomes a fact.
- The earliest authoritative-looking source is Botswana's own UNESCO World Heritage tentative list submission for the Chobe Linyanti System, filed on 27 May 2010. It says Chobe is 'probably known for its spectacular elephant population of over 50 000 today which is actually the highest elephant concentration in Africa'. Note the 'probably'. UNESCO's own disclaimer says sole responsibility for a tentative list's content lies with the state that filed it.
- The peer-reviewed version is circular. A 2016 remote-sensing paper on Chobe states that the park 'has the highest density of elephants on the planet' and cites Fullman and Child 2013 for it — a study of tree utilisation and water distribution that contains no such density comparison.
- The 2022 survey ranks it fifth. The Chobe River North-East Botswana stratum came in at 4.653 elephants per square kilometre, behind Mamili South in Namibia, NG31 in the Okavango, and two others.
- The highest density recorded anywhere in KAZA in 2022 was 10.8 per square kilometre — in the Kazungula stratum in Zimbabwe, directly across the river from Chobe, and the authors who published it caution that it could be an overcount.
Our own park record says this and it should not
The Chobe entry on this site describes the riverfront as carrying the densest elephant concentration in Africa, with tens of thousands coming down to drink. Neither half holds. The 2022 survey puts the riverfront stratum fifth in KAZA by density and at about seven thousand animals. We are flagging our own copy here rather than quietly fixing it, because a reader who has seen that line deserves to know it was wrong and why.
What is defensible, and worth saying instead: Chobe National Park provides critical habitat for the largest elephant population in Africa, and elephant numbers in the park have grown at a mean annual rate of between 5.5 and 7 per cent over the past forty years. Both statements come from a peer-reviewed paper. The same paper measures dry-season elephant biomass across the park at seven livestock standard units per square kilometre, rising to thirteen within five kilometres of the Chobe River — which is the real, measured version of the thing the superlative was reaching for. The river roughly doubles the concentration.
Fox & Alexander — 'Spatial Distribution and Population Densities of Elephants in a Semi-Arid Savanna', PLoS ONE, 13 October 2015
Read 28 September 2026. Peer-reviewed, and the source for the statement that Chobe National Park provides critical habitat for the largest elephant population in Africa and that elephant numbers in the park have grown at a mean annual rate of between 5.5 and 7 per cent over the past forty years. Its density figures are given in livestock standard units per square kilometre, not elephants per square kilometre — seven LSU per square kilometre across the park, rising to thirteen within five kilometres of the Chobe River — and we quote them only as the ratio between the two, which is the point. The same paper is also the source for the hydrology quoted here: the Chobe widens as it flows east through the park before narrowing and deepening across the Mambova fault to join the Zambezi, and during the annual flood water builds up behind that fault line and spreads outwards across the floodplain, reaching as far upstream as Lake Liambezi in high flood years.
https://journals.plos.org/plosone/article?id=10.1371/journal.pone.0139936UNESCO World Heritage Centre — Chobe Linyanti System, Botswana tentative list submission (Ref. 5556, submitted 27 May 2010)
Read 28 September 2026, through a text proxy after the direct URL returned a Cloudflare 403. Botswana's own submission by the Department of National Museum and Monuments, and the traceable origin of two figures repeated everywhere: that Chobe is 'probably known for its spectacular elephant population of over 50 000 today which is actually the highest elephant concentration in Africa', and that about 450 bird species are represented — a figure the same document later gives as about 440. UNESCO's own disclaimer states that sole responsibility for the content of a tentative list lies with the State Party. It is a government assertion from 2010 with no survey attached, not a count.
https://whc.unesco.org/en/tentativelists/5556/Schlossberg & Chase — Population trends and conservation status of elephants in Botswana and the KAZA TFCA: a review of elephant aerial surveys, 2010-2022 (Elephants Without Borders, April 2024)
Read 28 September 2026. A review of the whole Botswana aerial survey series by the team that flew most of it. Source for the statements that populations were generally stable or increased recently in Chobe National Park and in the Chobe riverfront area, that carcass ratios were generally lower or unchanged in Chobe National Park, that northern Botswana's all-carcass ratio rose from 8.2 per cent in 2018 to 12.4 per cent in 2022, that Chobe National Park is the only MIKE site in Botswana, and that the highest elephant density recorded anywhere in KAZA in 2022 was 10.8 per square kilometre in the Kazungula stratum in Zimbabwe, which the authors themselves caution could be an overcount.
https://elephantswithoutborders.org/site/wp-content/uploads/Final-EWB-Ele-Pop-Trends-KAZA-report-Mar24.pdfThe Savuti lions, and the one thing they are famous for
Savuti's reputation rests on a genuinely documented and genuinely unusual behaviour: its lions hunt elephant. This is not a guide's story. It was described in the peer-reviewed literature in 2009, and the description is precise enough to plan around.
- The switch to elephant prey happens in the late dry season, August to November — which is also when Savuti is at its most accessible and its driest.
- The frequency increased over the two decades from 1985 to 2005.
- A pride of thirty lions was recorded killing one elephant every three days.
- Seven of the eight elephants killed in the study were between four and eleven years old — weaned animals that are less dependent on their mothers and more exposed than either calves or adults.
- The authors attribute it to two things: conventional prey thinning out when the annual migration leaves, and artificial water making the elephant population more sedentary than it would otherwise be.
What that does and does not mean for a visit
It means the behaviour is real, seasonal, and concentrated in the months you would visit anyway. It does not mean you will see it. A study team with infrared filming equipment and a known pride is not a game drive, the observations span twenty years, and the pride described is not necessarily the pride at Savuti now. Go to Savuti for predators generally and treat elephant predation as the thing that might happen, not the thing you booked.
The buffalo half of the Savuti story deserves more caution. The 2022 survey counted 773 buffalo in Savuti North with an interval so wide as to be near meaningless, and none at all in the Savuti Marsh or Savuti East strata on the days they were flown. Buffalo move, and a single-day aerial count is a snapshot. But if you are going to Savuti specifically for large buffalo herds, the recent count does not support the expectation.
Power & Compion — 'Lion Predation on Elephants in the Savuti, Chobe National Park, Botswana', African Zoology 44(1), 2009
Read 28 September 2026. The peer-reviewed account of the Savuti lions hunting elephant. It reports that Botswana's Savuti lions switch to preying on elephants during the late dry season from August to November, that the frequency of this increased over 1985 to 2005, that a pride of thirty lions killed one elephant every three days, and that seven of eight elephants killed were aged between four and eleven. It attributes the behaviour to reduced conventional prey during the annual migration and to artificial water making the elephant population more sedentary.
https://doi.org/10.3377/004.044.0104KAZA Elephant Survey 2022, Volume II: stratum results
Read 28 September 2026. The volume that carries results stratum by stratum. Source for the Chobe River North-East Botswana stratum — 1,519.74 square kilometres, flown in a single four-hour flight on 1 October 2022 from Kasane, 7,072 elephants with a 95 per cent interval of 4,022 to 10,122 and a density of 4.653 per square kilometre — and for the Nogatsaa, Savuti North, Savuti Marsh and Savuti East strata quoted here. Survey strata are not park boundaries and the volume publishes no Chobe National Park total; we have not added strata together to make one.
https://kavangozambezi.org/wp-content/uploads/2024/11/KAZA-Elephant-Survey-Volume-II-part-1.pdfPuku and Chobe bushbuck — the two you cannot see anywhere else in Botswana
Behind the elephants, Chobe's riverfront holds two antelope that are the real reason a Southern African lister comes here, and both populations are far smaller than the park's fame suggests.
The two riverfront specialities
| Species | What is known | Where and when |
|---|---|---|
| Puku | In Botswana, restricted to a narrow band of floodplains along the Chobe River — nowhere else in the country. Fieldwork in 2001 to 2003 found the population had increased strongly on the 1960s but remained small, isolated and vulnerable, with 91 per cent of sightings on floodplain. | The open floodplain of the riverfront, close to water, in the dry season when the grass is short |
| Chobe bushbuck | A capture-recapture estimate along about 50 km of riverfront inside the park put the population at 39 animals, with a standard deviation of 7.47. The authors described it as the first objective estimate for the area. | Riverine thicket along the same strip, early and late, and much harder to see than the number suggests |
Neither species shows up usefully in the aerial survey. The 2022 count recorded zero puku and zero bushbuck in the Chobe riverfront stratum and 101 puku across the whole Botswana KAZA portion with a confidence interval of 24 to 237 — an aircraft at 90 metres over a floodplain simply does not see them. The ground literature is the source that matters here, and this is a good illustration of why one survey method does not answer every question.
Thirty-nine bushbuck along fifty kilometres
That number is worth sitting with. The bushbuck study also traced the population's history: low around 1900, a peak in the 1960s, decline to the 1990s, and no further decline between 1991 and the study. Chobe bushbuck are not rare because of anything a visitor does, but they are few, they are local, and if you see one on the riverfront you have seen a meaningful fraction of the population.
O'Shaughnessy, Cain & Owen-Smith — 'Comparative diet and habitat selection of puku and lechwe in northern Botswana', Journal of Mammalogy 95(5), 2014
Read 28 September 2026 (abstract, via the OpenAlex index). Source for the statement that in Botswana puku are restricted to a narrow band of floodplains along the Chobe River, whereas lechwe are far more abundant across the Chobe riverfront, the Linyanti swamps, the Kwando and the Okavango. Earlier work by Dipotso and Skarpe (2006), from fieldwork in 2001 to 2003, found puku strongly increased on the 1960s but concluded the population remains small, isolated and vulnerable, with 91 per cent of sightings in floodplain habitat.
https://doi.org/10.1644/13-MAMM-A-301Dipotso, Skarpe, Kelaeditse & Ramotadima — 'Chobe bushbuck in an elephant-impacted habitat along the Chobe River', African Zoology 42(2), 2007
Read 28 September 2026. A capture-recapture estimate from road counts along about 50 km of riverfront inside the park, putting the bushbuck population at 39 animals with a standard deviation of 7.47 — the authors say it is the first objective estimate for the area. They record evidence that the population was low around 1900, peaked in the 1960s and declined to the 1990s, with no further decline between 1991 and their study.
https://doi.org/10.3377/1562-7020(2007)42[261:CBIAEH]2.0.CO;2Bussiere & Potgieter — KAZA Elephant Survey 2022, Volume I: Results and Technical Report (KAZA TFCA Secretariat, Kasane, 2023)
Read 28 September 2026. The survey report itself, not reporting about it. A systematic transect aerial sample count flown 22 August to 28 October 2022 to CITES MIKE aerial survey standards, covering 310,865 square kilometres — 60 per cent of the 519,912 square kilometre KAZA transfrontier area — in 195 flights and 2,404 transects. It gives 227,900 elephants for KAZA with a 95 per cent confidence interval of 211,157 to 244,643, and 131,909 for Botswana's surveyed portion with an interval of 119,976 to 143,842 at a density of 1.067 per square kilometre. The report states explicitly that a country result represents only the surveyed portion of KAZA within that country, not the whole country.
https://kavangozambezi.org/wp-content/uploads/2024/11/1.-KAZA-Elephant-Survey_Volume-I.pdfThe interior, and the sable-and-roan expectation that the data does not support
Nogatsaa and the Ngwezumba pans are sold as the place for sable and roan away from the crowds. It is worth being honest about what is actually recorded there, because the interior is a long way to drive on a promise.
What the 2022 survey saw at Nogatsaa and Savuti North
| Stratum | Sable | Roan | Buffalo | Impala |
|---|---|---|---|---|
| Nogatsaa, 3,091 km2 | None seen | 18 estimated, 1 seen | 128 | 110 |
| Savuti North, 1,914 km2 | 254 estimated, 20 seen | 25 estimated, 2 seen | 773 | Not quoted |
Aerial counts undercount animals in woodland and a single day's flying is a snapshot, so 'none seen' is not 'none there'. But across 3,091 square kilometres of Nogatsaa on 10 September 2022 the survey saw one roan and no sable, and Botswana's whole KAZA portion holds an estimated 3,901 sable and 564 roan. Sable are not scarce in northern Botswana; they were not at Nogatsaa that day.
The independent assessment is blunter. A study comparing four northern Botswana sites for tourism potential, using data from 1998, classed Nogatsaa as low potential: five to six species seen commonly and regularly, against ten to twelve at the Okavango sites, and a significantly lower mean number of species per kilometre. It describes Nogatsaa as sitting about 70 km south of the Chobe River in typical dry woodland with no natural perennial water, its surface water limited to seasonal pans and eight artificial water points pumped through the dry season.
Go to Nogatsaa for the emptiness, not for the antelope
It is genuinely quiet, the pans hold water into the dry season when nothing else in the interior does, and the elephants there were estimated at 5,853 in September 2022. Those are real reasons to go. A reliable sable and roan sighting is not one of them, and anyone whose trip depends on those two species should say so to an operator before committing to the interior rather than after.
Winterbach, Whitesell & Somers — 'Wildlife Abundance and Diversity as Indicators of Tourism Potential in Northern Botswana', PLoS ONE, 26 August 2015
Read 28 September 2026. Compares four northern Botswana sites including Nogatsaa, using data collected in 1998. Source for Nogatsaa sitting about 70 km south of the Chobe River, for it being a typical dry woodland area lacking natural perennial water with surface water limited to seasonal pans and eight artificial water points pumped during the dry season, and for its classification as a low-tourism-potential site where five to six species were seen commonly and regularly against ten to twelve at the high-potential Okavango sites.
https://journals.plos.org/plosone/article?id=10.1371/journal.pone.0135595KAZA Elephant Survey 2022, Volume II: stratum results
Read 28 September 2026. The volume that carries results stratum by stratum. Source for the Chobe River North-East Botswana stratum — 1,519.74 square kilometres, flown in a single four-hour flight on 1 October 2022 from Kasane, 7,072 elephants with a 95 per cent interval of 4,022 to 10,122 and a density of 4.653 per square kilometre — and for the Nogatsaa, Savuti North, Savuti Marsh and Savuti East strata quoted here. Survey strata are not park boundaries and the volume publishes no Chobe National Park total; we have not added strata together to make one.
https://kavangozambezi.org/wp-content/uploads/2024/11/KAZA-Elephant-Survey-Volume-II-part-1.pdfBirds — 82 counted, 450 claimed, 460 advertised
Chobe's bird figure is a small case study in how these numbers propagate. Botswana Tourism Organisation says over 460 species have been recorded in the park. Botswana's 2010 UNESCO submission says about 450 in one paragraph and about 440 in another. Neither carries a method, a source or a checklist. The one recent primary count we could find is smaller, narrower and vastly better documented.
Three Chobe bird figures
| Figure | Source | What it is |
|---|---|---|
| Over 460 species | Botswana Tourism Organisation park page | An unattributed marketing figure for the whole park |
| About 450, and about 440 | Botswana's UNESCO tentative list submission, 27 May 2010 | A state party assertion, self-contradictory within one document |
| 82 waterbird species | Dipheko et al., published 1 July 2025 | Eight ground counts, wet and dry seasons, 2019 to 2025, by DWNP Kasane and BUAN researchers |
The 82 is not a rival to the 450 — it counts waterbirds only, along the river, from vehicles. It is included because it is the only figure of the three that comes with a method, a period and named researchers, and because the authors include the wildlife department's own staff at Kasane.
The study's other finding is more useful to a visitor than the total: it found no significant seasonal or year-to-year difference in the waterbird diversity index between 2019 and 2025. The Chobe River holds its waterbirds through the wet and the dry. Whatever the migrants do, the resident waterbird community on this stretch of river is stable, which means a birding boat trip in February is not the poor relation of one in September.
Dipheko, Sianga, Shabane, Seonyatseng et al. — 'Diversity of Waterbirds in Chobe River, Botswana', Journal of Sustainable Development 18(4), published 1 July 2025
Read 28 September 2026. Eight ground counts made from vehicles in wet and dry seasons between 2019 and 2025, by authors from the Department of Wildlife and National Parks at Kasane and the Botswana University of Agriculture and Natural Resources. It records a total of 82 waterbird species along the Chobe River over that period and finds no significant seasonal or year-to-year difference in the diversity index. Waterbirds only, and the only recent primary Chobe bird count we found.
https://doi.org/10.5539/jsd.v18n4p106Botswana Tourism Organisation — Chobe National Park
Read 28 September 2026. The national tourism parastatal's own park page. Source for the 1968 establishment date, the approximately 11,700 square kilometre area, the division of the park into four geographical areas — the Chobe riverfront, the Ngwezumba pans, Savute and Linyanti — and the figure of over 460 bird species recorded. It publishes no entry fee, no gate names, no opening hours and no booking procedure.
https://botswanatourism.co.bw/explore/chobe-national-parkUNESCO World Heritage Centre — Chobe Linyanti System, Botswana tentative list submission (Ref. 5556, submitted 27 May 2010)
Read 28 September 2026, through a text proxy after the direct URL returned a Cloudflare 403. Botswana's own submission by the Department of National Museum and Monuments, and the traceable origin of two figures repeated everywhere: that Chobe is 'probably known for its spectacular elephant population of over 50 000 today which is actually the highest elephant concentration in Africa', and that about 450 bird species are represented — a figure the same document later gives as about 440. UNESCO's own disclaimer states that sole responsibility for the content of a tentative list lies with the State Party. It is a government assertion from 2010 with no survey attached, not a count.
https://whc.unesco.org/en/tentativelists/5556/What seven thousand elephants do to a riverbank
The riparian woodland along the Chobe and Linyanti is one of the most studied elephant-impacted landscapes in Africa, and what you are looking at from a boat is a system in the middle of a long change. This is worth knowing because the dead and broken trees along the bank are not neglect; they are the subject of a twenty-year literature.
- A study of riparian canopy trees over more than two decades in northern Botswana found the composition shift from initial dominance by two Acacia species to those two species forming less than 5 per cent of the woodland canopy, with dead trees strongly associated with severe elephant damage including bark stripping and felling. That work was on the Linyanti River.
- Damage does not simply fall away with distance from water. At a local scale branch herbivory decreases with distance from water while debarking first decreases and then rises again; at a landscape scale debarking decreases with distance from the river but branch herbivory increases, except in the first ten kilometres where most earlier studies had looked.
- The elephant population itself has been growing at between 5.5 and 7 per cent a year over forty years, so the pressure is not a historical event.
- Carcass ratios are the counter-signal and they are reassuring for the park: the review of the whole survey series found carcass ratios generally lower or unchanged in Chobe National Park, against a rise across northern Botswana as a whole from 8.2 per cent in 2018 to 12.4 per cent in 2022.
Chobe is Botswana's only MIKE site
Chobe National Park is the only site in Botswana in the CITES programme for Monitoring the Illegal Killing of Elephants, which is why its carcass data get looked at more carefully than anywhere else in the country. Statistics Botswana's 2024 indicators, on DWNP's own numbers, record four elephant poaching incidents in Chobe district across 2020 to 2024, all four in 2024 — against 42 in Ngamiland over the same period. Chobe is the watched park and, on those numbers, the quieter one.
Teren, Owen-Smith & Erasmus — 'Elephant-mediated compositional changes in riparian canopy trees over more than two decades in northern Botswana', Journal of Vegetation Science 29(4), 2018
Read 28 September 2026 (abstract, via Crossref). Source for the finding that the composition of riparian canopy trees changed from initial dominance by two Acacia species to those two species forming less than 5 per cent of the woodland canopy, and that dead trees were strongly associated with severe damage inflicted by elephants including bark stripping and felling. The fieldwork is on the Linyanti River rather than the Chobe riverfront, which is worth saying when the same view is pointed out from a boat below Kasane.
https://doi.org/10.1111/jvs.12638Fullman & Child — 'Water distribution at local and landscape scales affects tree utilization by elephants in Chobe National Park, Botswana', African Journal of Ecology 51, 2013
Read 28 September 2026 (abstract, via Crossref). Source for the finding that at a local scale branch herbivory decreases with distance from water while debarking first decreases and then increases again, and that at a landscape scale debarking decreases with distance from the river but branch herbivory increases, except within the first ten kilometres where previous studies had focused. Also worth naming because it is the paper a widely repeated claim that Chobe has the highest elephant density on the planet is cited to, and it contains no such comparison.
https://doi.org/10.1111/aje.12026Schlossberg & Chase — Population trends and conservation status of elephants in Botswana and the KAZA TFCA: a review of elephant aerial surveys, 2010-2022 (Elephants Without Borders, April 2024)
Read 28 September 2026. A review of the whole Botswana aerial survey series by the team that flew most of it. Source for the statements that populations were generally stable or increased recently in Chobe National Park and in the Chobe riverfront area, that carcass ratios were generally lower or unchanged in Chobe National Park, that northern Botswana's all-carcass ratio rose from 8.2 per cent in 2018 to 12.4 per cent in 2022, that Chobe National Park is the only MIKE site in Botswana, and that the highest elephant density recorded anywhere in KAZA in 2022 was 10.8 per square kilometre in the Kazungula stratum in Zimbabwe, which the authors themselves caution could be an overcount.
https://elephantswithoutborders.org/site/wp-content/uploads/Final-EWB-Ele-Pop-Trends-KAZA-report-Mar24.pdfFox & Alexander — 'Spatial Distribution and Population Densities of Elephants in a Semi-Arid Savanna', PLoS ONE, 13 October 2015
Read 28 September 2026. Peer-reviewed, and the source for the statement that Chobe National Park provides critical habitat for the largest elephant population in Africa and that elephant numbers in the park have grown at a mean annual rate of between 5.5 and 7 per cent over the past forty years. Its density figures are given in livestock standard units per square kilometre, not elephants per square kilometre — seven LSU per square kilometre across the park, rising to thirteen within five kilometres of the Chobe River — and we quote them only as the ratio between the two, which is the point. The same paper is also the source for the hydrology quoted here: the Chobe widens as it flows east through the park before narrowing and deepening across the Mambova fault to join the Zambezi, and during the annual flood water builds up behind that fault line and spreads outwards across the floodplain, reaching as far upstream as Lake Liambezi in high flood years.
https://journals.plos.org/plosone/article?id=10.1371/journal.pone.0139936Statistics Botswana — Botswana Selected Environmental Indicators 2024 (published August 2026)
Read 28 September 2026. The fourth edition in the national five-yearly environmental statistics series, ISBN 978-99968-81-82-4, published August 2026, with the wildlife chapter sourced throughout to the Department of Wildlife and National Parks. It carries district-level tables for Chobe on poaching, problem-animal incidents and wildlife mortality. It is the one current, downloadable, government-published dataset on Chobe wildlife we found, and it is worth noting that DWNP data reaches the public through the statistics office rather than through DWNP.
https://www.statsbots.org.bw/sites/default/files/Botswana%20Selected%20Environmental%20Indicators%202024.pdf