
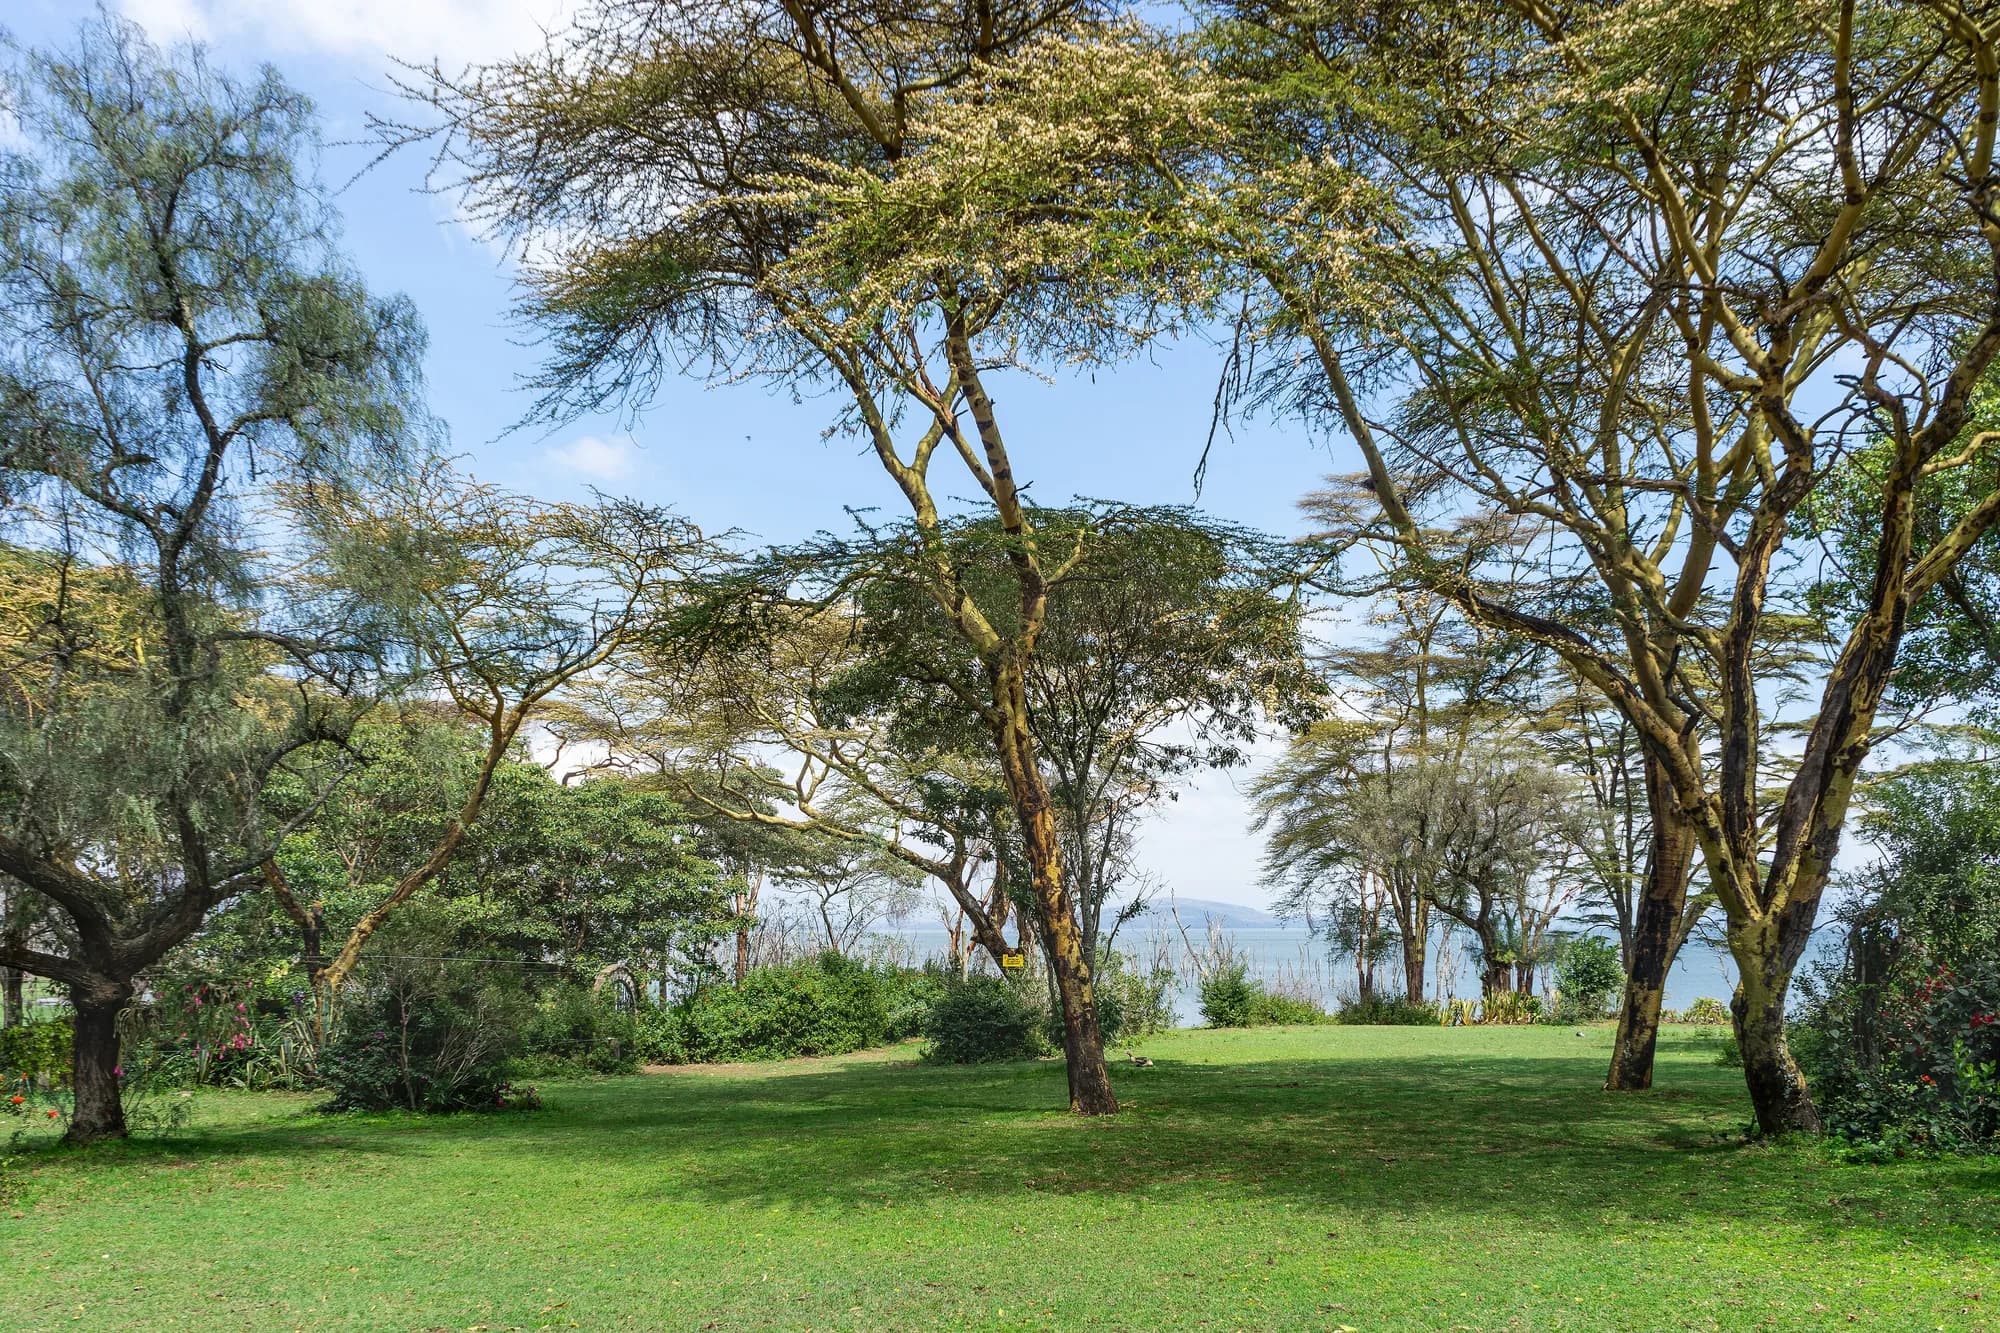
Kenya / Lake Nakuru / Best time to visit — Lake Nakuru
Best time to visit — Lake Nakuru
At most parks on this site the month is the biggest decision you make. At Lake Nakuru it is close to the smallest — and the reason is the fence.
Why season matters less here than anywhere else in Kenya
The seasonal logic of an African safari park runs like this: in the dry season the ephemeral water goes, the game concentrates on what is left, and viewing improves; in the wet season the animals disperse across a wide landscape and you see less. Almost none of that applies at Lake Nakuru, and it is worth understanding why before you spend effort choosing a month.
- The park is fenced all the way round. The game cannot disperse out of it, because there is nowhere to disperse to — the land outside is farmland and a city of more than half a million people.
- The lake is permanent and, at present, larger than it has been at any point in the satellite record. Water is not the limiting resource here in the way it is at Amboseli or Tsavo.
- The park is 188 square kilometres with about 135 of that on land. That is small enough to drive out in a day in any month.
- The headline animal is rhino, which is territorial, does not migrate, and is in the park in January for the same reason it is in the park in August.
What season does change here is the driving and the light: whether the tracks are passable, whether the southern rivers are running, how green the woodland is, and how much dust is in the air on the escarpment. Those are real differences. They are not the difference between seeing the park and not seeing it.
Wilkinson, McInturff, Kelly and Brashares — "Quantifying wildlife responses to conservation fencing in East Africa", Biological Conservation 256, 109071 (2021)
Read 28 September 2026 from the University of California eScholarship copy. A year of camera trapping on the Lake Nakuru perimeter fence itself, and the single best source on what the fence here actually does. Findings used: the park is 188 square kilometres, the lake covers nearly a third of it and the land area is about 135 square kilometres; the park lies directly west of the 190-square-kilometre Soysambu Conservancy, a partly fenced private reserve and working ranch carrying 10,000 sheep, goats and cattle; Nakuru city sits directly north and had a population of 570,000 in 2019; four rivers enter the park, three from the south and one from the north-west; and wildlife density inside the park is at least 20 per cent higher than on the community land outside it. On the fence: 19 cameras recorded 65,560 photographs of mammals and 3,626 crossings over 2,818 trap nights, 38 wild mammal species approached known weak points, 27 of them were recorded crossing, every large carnivore species in the park crossed, and repaired gaps were breached again within days.
https://doi.org/10.1016/j.biocon.2021.109071The rain, and how much more of it there now is
Lake Nakuru's catchment is 1,471 square kilometres, running up into the Eastern Mau forest, and its mean annual rainfall over 1981 to 2020 was 1,013 mm. The region runs two wet seasons and two dry ones, the long rains falling broadly March to May and the short rains around November.
Catchment rainfall, before and after the change
| Period | Mean annual catchment rainfall | Change |
|---|---|---|
| 1984 to 2009 | 1,203.7 mm | The baseline |
| 2010 to 2020 | 1,385.1 mm | Up about 20 per cent, or 193 mm |
| 1984 to 2020, whole record | 1,257.7 mm | - |
Actual evapotranspiration rose too, but by only about 11 per cent against the rainfall's 20. That gap is the water that ended up in the lake. The paper's striking finding is how little was needed: an increase equivalent to 19.4 mm a year, around 0.4 to 2 per cent of pre-rise annual rainfall, is enough to explain the entire rise in level.
That last point is the one to carry away from this section. You do not need a dramatic change in the weather to drown a shallow endorheic lake in a flat basin. You need a small, sustained surplus, and the Rift has had one since about 2010.
Herrnegger, Stecher, Schwatke and Olang — "Hydroclimatic analysis of rising water levels in the Great Rift Valley Lakes of Kenya", Journal of Hydrology: Regional Studies 36, 100857 (25 June 2021)
Read 28 September 2026 from the open-access copy deposited on EarthArXiv, the published paper being behind a paywall at the publisher. Findings used here: Lake Nakuru's surface area in December 2020 was 70 per cent larger than its 1984-2009 mean; its largest mean annual area over the record was 62.3 square kilometres at a level of 1766.2 metres, in 2020; the total range between its lowest and highest recorded water level is 6.40 metres; the catchment is 1,471 square kilometres with a mean annual rainfall of 1,013 mm over 1981-2020, rising by about 20 per cent, or 193 mm, in the eleven years after 2009; the lake is fed by the Baharini spring on its eastern shore, the permanent Ngosur river and four seasonal rivers — the Njoro, Nderit, Makalia and Lamudhiak, all rising in the Eastern Mau forest. The paper states that the rise "changed the water quality of the normally alkaline-saline lake, leading to loss of the algae abundance. In consequence, a vast number of Flamingos have left." It also records, citing Onywere and others (2013), that flood inundation left about 60 per cent of the park inaccessible, and, citing Obando and others (2016), that the main administrative block was flooded.
https://doi.org/10.1016/j.ejrh.2021.100857Ampting, van der Ent, van de Giesen and Kiluva — "Recent rise of water levels of Lake Nakuru, Kenya: unravelling the changing precipitation regime and its climatic drivers", EarthArXiv preprint (21 January 2025)
Read 28 September 2026, and flagged as what it is: a preprint. It had no journal version recorded as of that date, so it has not been through peer review and is cited here only for the shape of the timeline, which independent peer-reviewed work supports. It describes "an abrupt and significant rise in its lake levels since 2010, followed by a more rapid rise since 2020", identifies a change point in precipitation in 2010 that aligns with the lake's rise, and attributes the change to a southward shift in moisture sources towards the southern Indian Ocean.
https://doi.org/10.31223/x5m70dMonth by month
What each part of the year is actually like
| Months | Conditions | Verdict |
|---|---|---|
| January to February | Hot and dry, clear, dusty on the escarpment, southern rivers low | Very good. Best driving conditions of the year and no peak pricing |
| March to May | Long rains; tracks soften, lakeshore sections can close, everything green | The one period to think twice about, and the cheapest |
| June to September | Dry, cooler, reliable tracks, peak international season | The default. Busiest, and busiest by a long way in August |
| October | Dry tailing into the short rains, green returning, quieter | Underrated. Good conditions and thinner traffic |
| November to December | Short rains; patchy, green, dramatic light, Makalia running | Good value, and the best month for the southern end |
The park record on this site gives the best months as June to March, which is the same judgement stated as a range: everything except the long rains.
The long rains are a driving problem, not a wildlife problem
In March to May the animals are still inside the fence and the rhino are still findable. What changes is that lakeshore tracks flood, some of the park becomes inaccessible, and the lake is at its least photogenic under grey cloud. If you are coming for rhino and the price is right, April is a defensible choice. If you are coming for the view from Baboon Cliff, it is not.
No month will bring the flamingos back
This section exists because it is the question people actually ask, phrased as "what month are the flamingos there". The honest answer is that the question no longer has a seasonal answer at this lake, and choosing a month on that basis will not work.
Lesser flamingos are nomadic and follow food. What they eat is a cyanobacterium, Arthrospira fusiformis, which needs a salinity of roughly 20 to 70 grams of salt per litre and a pH of around 9 to thrive. Lake Nakuru has grown by about 90 per cent in surface area since 2009, and freshwater dilution has pushed the chemistry away from that window. Mean chlorophyll-a — the measure of how much of that food is in the water — has fallen at Nakuru from more than 400 mg per cubic metre to less than 200, against a threshold of 355 for what the researchers classify as high-quality feeding water.
What this means for choosing a date
Flamingo presence at Lake Nakuru now tracks the lake's chemistry and food supply, which move on a scale of years rather than months, and which nobody publishes as a forecast. There are still flamingos at Nakuru and there are still days when there are a lot of them. There is no month you can book that makes that likely. If flamingos are genuinely the reason for the trip, the wildlife page sets out what the evidence says about where to look instead — and it is more equivocal than the marketing on either lake suggests.
Byrne, Tebbs, Njoroge, Nkwabi, Chadwick, Freeman and Norris — "Productivity declines threaten East African soda lakes and the iconic Lesser Flamingo", Current Biology 34, 1786-1793 (22 April 2024)
Read 28 September 2026 from the open-access version of record. This is the paper that settles the flamingo question, and it is the reason this park's wildlife page reads the way it does. The authors combined satellite Earth observation with flamingo count data across 22 East African soda lakes from 1999 to 2022. Findings used here: lake surface areas across the 22 lakes rose by an average of 0.32 square kilometres a year; chlorophyll-a — the measure of the phytoplankton the birds eat — fell by 3.9 mg per cubic metre a year; 18 of the 22 lakes were at their least productive when their surface area was greatest; Lake Nakuru grew in surface area by 90.7 per cent between 2009 and 2022 and its mean chlorophyll-a fell from more than 400 mg per cubic metre to less than 200; the threshold the authors use for high-quality feeding water is 355 mg per cubic metre, which corresponds to an Arthrospira fusiformis density of 50 mg dry weight per litre; and at Bogoria and Nakuru the loss of high-quality feeding habitat since 2010 coincided with declining flamingo numbers. The paper describes Nakuru as "one of the most important Flamingo feeding lakes in East Africa, historically supporting over one million birds at a time". It does not give a current Nakuru count, and neither do we.
https://doi.org/10.1016/j.cub.2024.03.006Time of day beats time of year
If the month is the small decision here, the hour is the large one. KWS opens the gates at 6:00 am and closes them at 6:00 pm unless you are staying inside, and those two edges are where the park is worth being in.
The day, at Lake Nakuru
| When | What it is for |
|---|---|
| 06:00 to 08:30 | Rhino. Both species are most findable in the cool, and white rhino are out on open grazing |
| 08:30 to 11:00 | Woodland. Giraffe in the fever trees, and the best chance at the thicket edges |
| 11:00 to 15:00 | The escarpment. Baboon Cliff and the southern lookouts, and a picnic site rather than a drive |
| 15:00 to 18:00 | The lakeshore circuit again, working back towards your gate with light to spare |
This is a shape rather than a schedule and it is ours, not KWS's. The one part of it that is not negotiable is the start: a party that leaves a Nakuru city hotel at eight has already spent the best part of the day in traffic.
Crowding, and the domestic weekend
Lake Nakuru has a visitor profile most Kenyan parks do not: it is close enough to Nairobi to be a day out, its gate is four kilometres from a city of 570,000, and Kenya Wildlife Service prices event sites, photo sessions, wedding and graduation shoots, warden's lectures and conference group rates for premium parks — which is to say, for this park and Amboseli. Those are not lines written for a foreign safari market.
- Weekends and Kenyan public holidays carry domestic traffic that midweek does not.
- August is the peak of the international season and the busiest month on the circuit as a whole.
- The northern lakeshore and Baboon Cliff take the great majority of day-visitor traffic, because that is the loop a half-day allows.
- The southern end towards Nderit and Makalia is where the vehicles are not, in any month.