
Kenya / Lake Nakuru / Zones — Lake Nakuru
Zones — Lake Nakuru
There are no numbered zones at Lake Nakuru. There is a fence, a lake inside it that has grown by 70 per cent since the 1980s, and a ring of land around the water that is now a good deal narrower than the maps suggest.
One fenced park, and the arithmetic of the water
Lake Nakuru National Park is 188 square kilometres, a figure both Kenya Wildlife Service and the peer-reviewed literature agree on. What has changed is the split between water and land inside that boundary, and it is the most important thing to understand about the shape of the park today.
The park, by the numbers
| Figure | Value | Source |
|---|---|---|
| Park area | 188 km2 | KWS park page; Wilkinson 2021; Herrnegger 2021 |
| Lake as a share of the park | Nearly one third | Wilkinson 2021, citing Elliot 2020 |
| Land area remaining | About 135 km2 | Wilkinson 2021 |
| Largest mean annual lake area on record | 62.3 km2, at a level of 1766.2 m, in 2020 | Herrnegger 2021 |
| Lake area in December 2020 against the 1984-2009 mean | 70 per cent larger | Herrnegger 2021 |
| Lake surface area change, 2009 to 2022 | Up 90.7 per cent | Byrne 2024 |
| Range between lowest and highest recorded water level | 6.40 m | Herrnegger 2021 |
Two independent studies measuring over slightly different windows give 70 per cent and 90.7 per cent. They are not in conflict — Herrnegger compares December 2020 with a 1984-2009 baseline and Byrne compares 2009 with 2022 — but they are not the same number and we have not averaged them.
Put the figures together and the geography follows. A 62.3 square kilometre lake inside a 188 square kilometre park is 33 per cent of it, which is the arithmetic behind the independent "nearly one third" estimate. The land you can actually drive is a ring, and that ring has been narrowing for fifteen years.
Herrnegger, Stecher, Schwatke and Olang — "Hydroclimatic analysis of rising water levels in the Great Rift Valley Lakes of Kenya", Journal of Hydrology: Regional Studies 36, 100857 (25 June 2021)
Read 28 September 2026 from the open-access copy deposited on EarthArXiv, the published paper being behind a paywall at the publisher. Findings used here: Lake Nakuru's surface area in December 2020 was 70 per cent larger than its 1984-2009 mean; its largest mean annual area over the record was 62.3 square kilometres at a level of 1766.2 metres, in 2020; the total range between its lowest and highest recorded water level is 6.40 metres; the catchment is 1,471 square kilometres with a mean annual rainfall of 1,013 mm over 1981-2020, rising by about 20 per cent, or 193 mm, in the eleven years after 2009; the lake is fed by the Baharini spring on its eastern shore, the permanent Ngosur river and four seasonal rivers — the Njoro, Nderit, Makalia and Lamudhiak, all rising in the Eastern Mau forest. The paper states that the rise "changed the water quality of the normally alkaline-saline lake, leading to loss of the algae abundance. In consequence, a vast number of Flamingos have left." It also records, citing Onywere and others (2013), that flood inundation left about 60 per cent of the park inaccessible, and, citing Obando and others (2016), that the main administrative block was flooded.
https://doi.org/10.1016/j.ejrh.2021.100857Wilkinson, McInturff, Kelly and Brashares — "Quantifying wildlife responses to conservation fencing in East Africa", Biological Conservation 256, 109071 (2021)
Read 28 September 2026 from the University of California eScholarship copy. A year of camera trapping on the Lake Nakuru perimeter fence itself, and the single best source on what the fence here actually does. Findings used: the park is 188 square kilometres, the lake covers nearly a third of it and the land area is about 135 square kilometres; the park lies directly west of the 190-square-kilometre Soysambu Conservancy, a partly fenced private reserve and working ranch carrying 10,000 sheep, goats and cattle; Nakuru city sits directly north and had a population of 570,000 in 2019; four rivers enter the park, three from the south and one from the north-west; and wildlife density inside the park is at least 20 per cent higher than on the community land outside it. On the fence: 19 cameras recorded 65,560 photographs of mammals and 3,626 crossings over 2,818 trap nights, 38 wild mammal species approached known weak points, 27 of them were recorded crossing, every large carnivore species in the park crossed, and repaired gaps were breached again within days.
https://doi.org/10.1016/j.biocon.2021.109071The gates
The three gates KWS lists
| Gate | Where | What it suits |
|---|---|---|
| Main Gate | 4 km from Nakuru city, at the northern end | Anyone arriving from Nairobi on the A104, and anyone sleeping in town |
| Lanet Gate | Off the Nairobi-Nakuru highway, east side | Arriving from the Nairobi direction without going into the city |
| Nderit Gate | Southern end of the park | Arriving from or leaving towards Elementaita and Naivasha |
KWS names all three and gives their road context; it does not publish distances between them or drive times inside the park, and neither do we.
Gate hours are 6:00 am to 6:00 pm unless you are staying overnight inside, and KWS states them as entry and exit times rather than as opening hours. On a park whose two good hours are the first and the last, that twelve-hour window is the constraint the whole day is built around.
The gate you leave by is a planning decision
Entering at the Main Gate and leaving at Nderit takes you the length of the park and puts you on the southern road towards Elementaita and Naivasha without doubling back. Entering and leaving at the Main Gate because that is where you came in is the commonest way to spend an hour of a short visit on tarmac you have already driven.
Kenya Wildlife Service — Lake Nakuru National Park
Read 28 September 2026. This is the department's own park page, and on this date it answered — which is worth recording, because kws.go.ke refuses automated requests often enough that other Kenyan parks on this site carry their figures as "read failed, carried from record". The page gives the park history to the year, the gate list, the distance from Nairobi, the accommodation list, the gate hours and the in-park rules, and it prints the same four-band conservation fee as the national schedule. It does not give a rhino population, a flamingo count or a drive time, and neither does this page.
https://kws.go.ke/park/lake-nakuru-national-park/The lakeshore circuit, and what the water took
The lakeshore circuit is the park's spine: a loop of track following the water round, with spurs inland. It is also the part of the park the rising lake has rewritten, and a visitor who has seen photographs from 2008 will find the drive materially different from the one those photographs show.
The flooding is documented rather than anecdotal. Herrnegger and colleagues record, citing Onywere and others from 2013, that flood inundation around the lake affected the park's road infrastructure to the point where about 60 per cent of the park was inaccessible, and, citing Obando and others from 2016, that the damage extended to buildings including the main administrative block. A Landsat study of land cover inside the boundary between 1987 and 2016 found the dominant change within the park was a 51 per cent increase in the area covered by lake water, destroying shoreline vegetation and infrastructure with it.
The dates on those figures matter
The 60 per cent inaccessibility figure is an assessment of the 2013 flooding, not of the park in 2026, and the 51 per cent land-cover change runs to 2016. Both are given here because they are what is published and because they establish the scale of what happened. Neither is a statement about which specific tracks are open on the day you arrive, which is a question for the gate.
What that history produces on the ground is the visual signature of Lake Nakuru today: stands of dead trees standing in open water, drowned shoreline, and a road network that has been pushed back from the water in places and rebuilt in others. It photographs extraordinarily well and it is a record of a landscape being lost, which are both true at once.
"Mapping vegetation status at Lake Nakuru National Park and surrounds, Kenya" — Miami University thesis, OhioLINK ETD Center (2017)
Read 28 September 2026, and flagged as a graduate thesis rather than a peer-reviewed paper — it is used here because it is the only source we could find that maps what happened to the vegetation inside the boundary, and nothing in it is quoted that a lodge brochure would have any reason to dispute. Using Landsat imagery from 1987 to 2016 and a Random Forest classifier at 85.5 per cent accuracy, it reports that the major land-cover change inside the park was a 51 per cent increase in the area covered by lake water, destroying shoreline vegetation types and infrastructure; that the euphorbia forest was completely destroyed following a fire; and that the acacia woodland declined overall.
https://etd.ohiolink.edu/acprod/odb_etd/ws/send_file/send?accession=miami1498015331943846&disposition=inlineThe escarpment lookouts
The park is bowl-shaped, and the high ground on its western and southern sides carries the viewpoints that give Lake Nakuru its postcard. KWS's park page lists "scenic viewpoints and picnic sites" among the attractions without naming them, and picnic charges appear on the national schedule at KSh 100 or USD 10 per person within a KWS station.
- Baboon Cliff, on the western escarpment — the best-known of the lookouts and the one most day itineraries stop at.
- Out of Africa lookout, higher and further south along the same escarpment, giving the long view down the length of the lake.
- Lion Hill, on the eastern side above the lakeshore.
- Makalia, at the southern end, which is a destination rather than a viewpoint and has its own section below.
The lookouts have gained rather than lost from the flooding, which is a genuinely odd thing to write. A bigger lake is a better view from above, and the escarpment is the one part of the park that the water could not reach.
Makalia Falls and the southern end
Makalia Falls sits at the southern end of the park and is one of the two features KWS names explicitly on its attractions list, the other being the rhino sanctuary. The Makalia is one of the four seasonal rivers feeding the lake, all of which rise in the Eastern Mau forest above the park — the others being the Njoro, the Nderit and the Lamudhiak. A fifth, the Ngosur, is permanent, and the Baharini spring feeds the lake from the eastern shore.
Seasonal means seasonal
The Makalia is a seasonal river. The falls are worth the drive after rain and are worth considerably less in the middle of a dry spell, and no source publishes a month-by-month flow. If the southern end is the reason you are adding an afternoon, ask at the gate whether there is water in it before you commit the time.
The southern end is also the quiet end. Most day traffic enters at the Main Gate, drives the northern lakeshore, climbs to the western lookouts and turns round. Committing to Makalia means committing to the length of the park, which is the single easiest way to get away from other vehicles here.
Herrnegger, Stecher, Schwatke and Olang — "Hydroclimatic analysis of rising water levels in the Great Rift Valley Lakes of Kenya", Journal of Hydrology: Regional Studies 36, 100857 (25 June 2021)
Read 28 September 2026 from the open-access copy deposited on EarthArXiv, the published paper being behind a paywall at the publisher. Findings used here: Lake Nakuru's surface area in December 2020 was 70 per cent larger than its 1984-2009 mean; its largest mean annual area over the record was 62.3 square kilometres at a level of 1766.2 metres, in 2020; the total range between its lowest and highest recorded water level is 6.40 metres; the catchment is 1,471 square kilometres with a mean annual rainfall of 1,013 mm over 1981-2020, rising by about 20 per cent, or 193 mm, in the eleven years after 2009; the lake is fed by the Baharini spring on its eastern shore, the permanent Ngosur river and four seasonal rivers — the Njoro, Nderit, Makalia and Lamudhiak, all rising in the Eastern Mau forest. The paper states that the rise "changed the water quality of the normally alkaline-saline lake, leading to loss of the algae abundance. In consequence, a vast number of Flamingos have left." It also records, citing Onywere and others (2013), that flood inundation left about 60 per cent of the park inaccessible, and, citing Obando and others (2016), that the main administrative block was flooded.
https://doi.org/10.1016/j.ejrh.2021.100857The acacia and euphorbia woodland
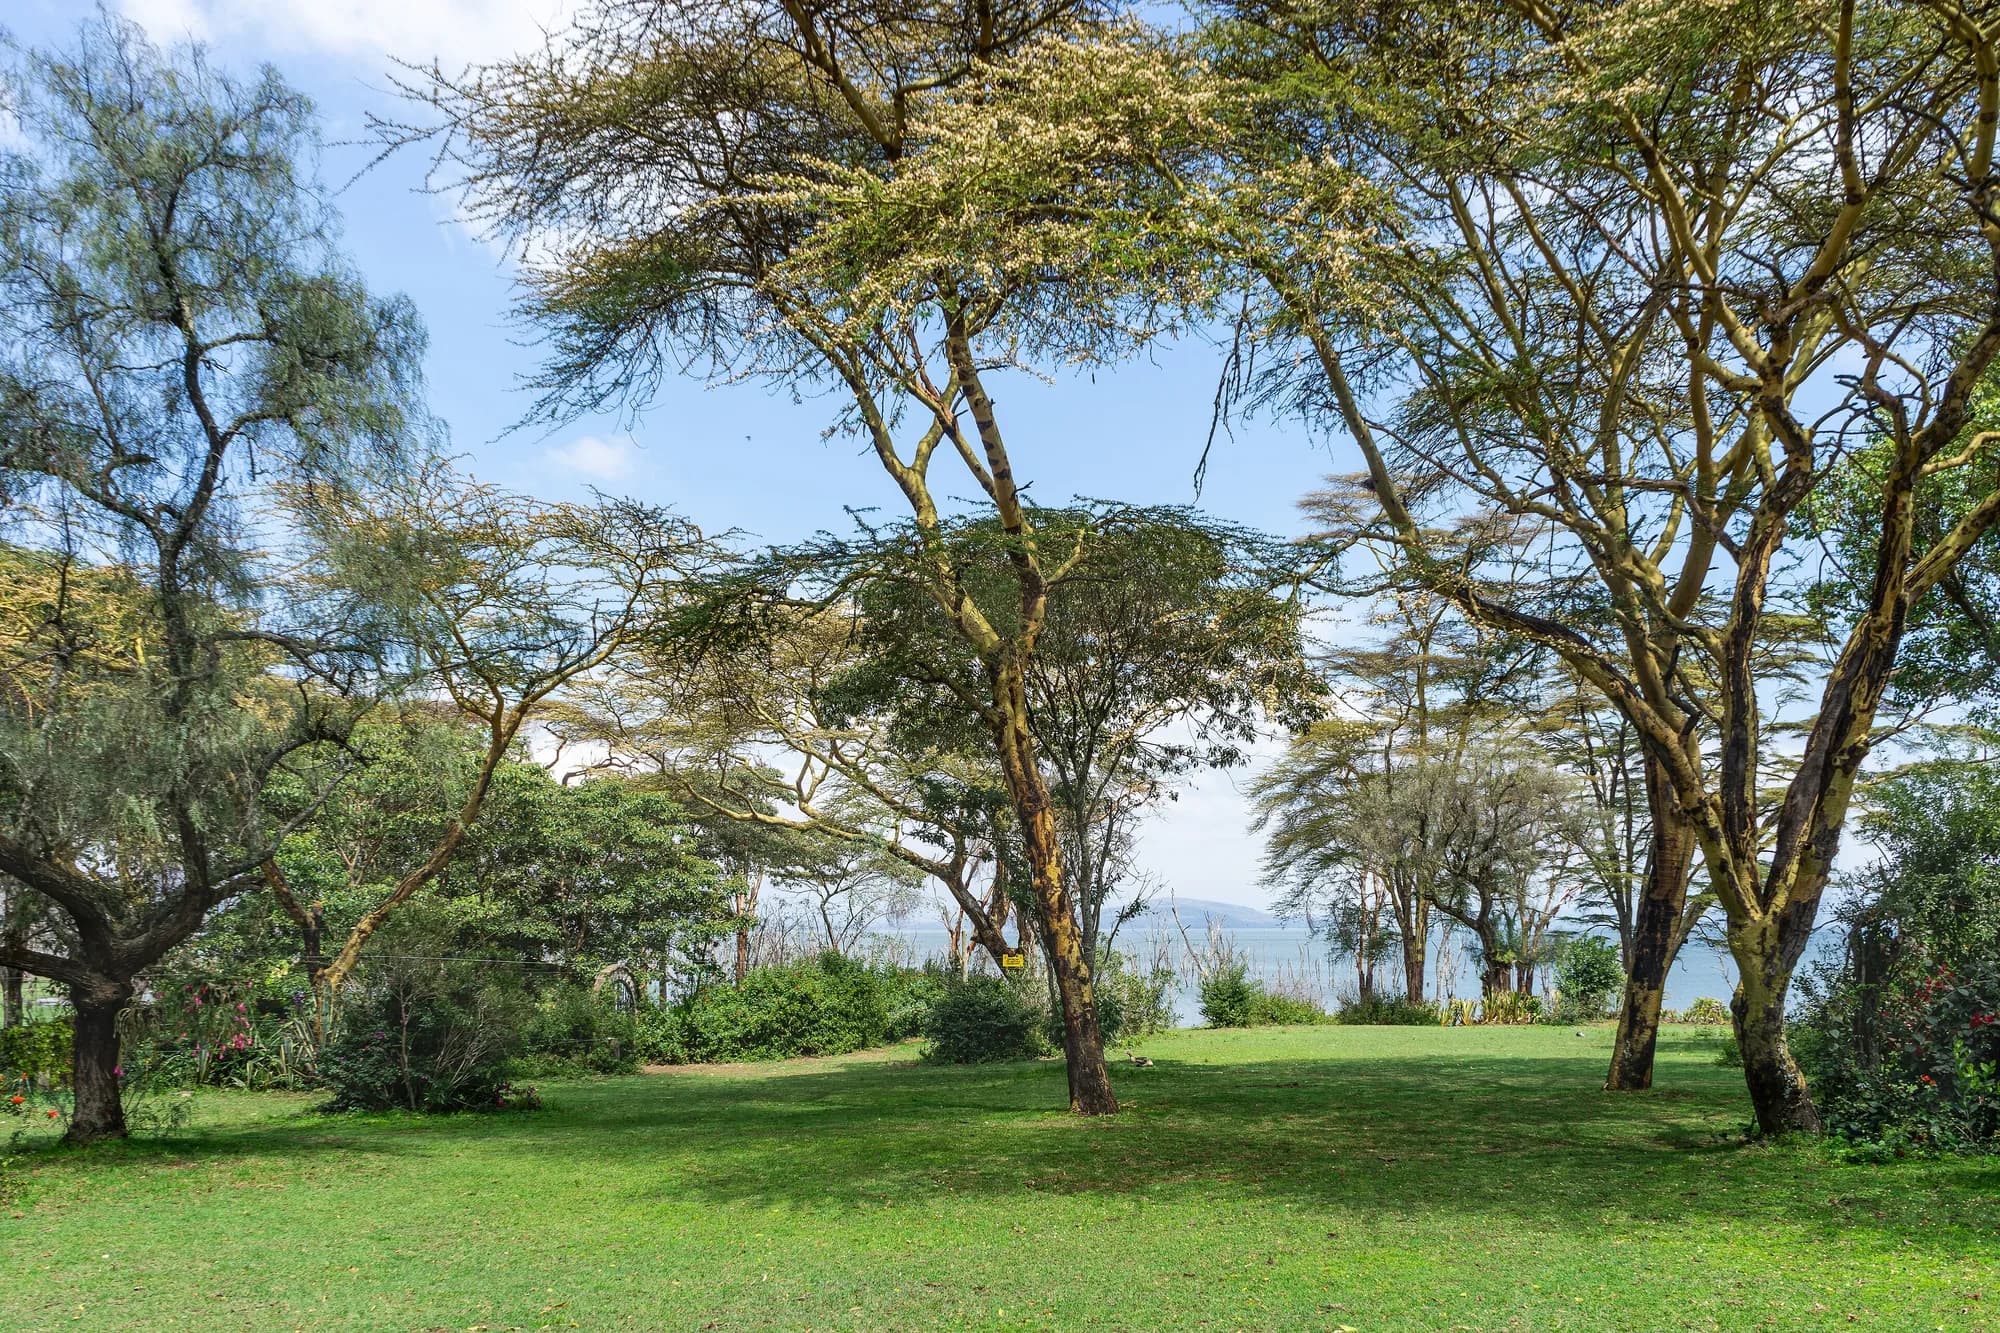
Away from the water the park is woodland and grassland on the rising ground, and two tree communities give it its character. The first is the yellow-barked fever tree, Vachellia xanthophloea, which forms the pale-trunked stands along the old shoreline; the giraffe study carried out here found it accounted for 67 per cent of all giraffe foraging records, 4,136 out of 6,215 observations. The second is the euphorbia forest on the eastern slopes, a stand of candelabra euphorbia that is unusual enough to be an attraction in its own right.
Both communities are in trouble, for different reasons
The Landsat land-cover study of 1987 to 2016 found an overall decline in acacia woodland inside the park and the complete destruction of the euphorbia forest following a fire. The acacia decline is the same signal the 2009 giraffe paper reached for when it looked for an explanation of that population's crash — a park with a fixed boundary, a rising lake and a shrinking browse base squeezes its browsers from both sides.
For a visitor this is not an abstraction. The woodland belt is where you look for giraffe, for black rhino in the thicket margins and for the park's leopards, and it is the part of Lake Nakuru that is quietly being narrowed between the water below and the fence above.
Gitau, Mbau, Ngugi, Ngumbi and Muneza — "Activity budget and foraging patterns of Nubian giraffe in Lake Nakuru National Park, Kenya", Ecology and Evolution 14(6), e11463 (30 May 2024)
Read 28 September 2026 from the abstract of record; the publisher refused the full text to an automated request on the same day. The study recorded 11,280 giraffe activities in the park, 4,560 in the dry season and 6,720 in the wet. Foraging took 53 per cent of the dry-season budget and 57 per cent of the wet-season one. The figure quoted on these pages is the diet: Vachellia xanthophloea, the yellow-barked fever tree, accounted for 67 per cent of foraging records, 4,136 out of 6,215. Note also the name the paper uses. The animal this park is famous for is still widely sold as Rothschild's giraffe; current taxonomy treats it as the Nubian giraffe, Giraffa camelopardalis camelopardalis, and this paper is written that way.
https://doi.org/10.1002/ece3.11463"Mapping vegetation status at Lake Nakuru National Park and surrounds, Kenya" — Miami University thesis, OhioLINK ETD Center (2017)
Read 28 September 2026, and flagged as a graduate thesis rather than a peer-reviewed paper — it is used here because it is the only source we could find that maps what happened to the vegetation inside the boundary, and nothing in it is quoted that a lodge brochure would have any reason to dispute. Using Landsat imagery from 1987 to 2016 and a Random Forest classifier at 85.5 per cent accuracy, it reports that the major land-cover change inside the park was a 51 per cent increase in the area covered by lake water, destroying shoreline vegetation types and infrastructure; that the euphorbia forest was completely destroyed following a fire; and that the acacia woodland declined overall.
https://etd.ohiolink.edu/acprod/odb_etd/ws/send_file/send?accession=miami1498015331943846&disposition=inlineThe fence, which is the whole park
Lake Nakuru is fenced all the way round. An electric perimeter fence was built in 1986, and KWS describes it as a landmark conservation intervention in Kenya at the time. It is the single most unusual structural fact about this park and it explains almost everything else: it is why the rhino are here, why the game does not disperse, why densities are high, and why the park has the problems it has.
Two peer-reviewed sources, two different claims
Herrnegger and colleagues state that Lake Nakuru National Park "is the only park within Kenya to be entirely fenced". Wilkinson and colleagues, in a paper about this very fence, state that it "is one of only two fully fenced national parks in Kenya" and do not name the other. Both are peer-reviewed, both were read this session, and we are not going to quietly pick the tidier one. What both agree on, and what matters, is that this is close to unique in the Kenyan estate.
The fence is also considerably less solid than the word suggests. A year of camera trapping along it recorded 65,560 photographs of mammals and 3,626 crossings over 2,818 trap nights at 19 sites. Thirty-eight wild mammal species approached known weak points and 27 were recorded crossing. Every large carnivore species in the park crossed it. Baboons and vervets cross daily. Repaired gaps were breached again within days of the repair. The eleven species that did not cross were mostly ungulates — and, one presumes though the study did not test it, rhino.
Context outside the wire matters too. The park sits directly west of the 190-square-kilometre Soysambu Conservancy, a partly fenced private reserve and working ranch carrying 10,000 sheep, goats and cattle, and adjacency to Soysambu was one of the strongest predictors of where animals crossed. Directly north is Nakuru city, 570,000 people in 2019 and Kenya's fourth largest. Wildlife density inside the park is at least 20 per cent higher than on the community land around it. This is a wildlife island in a farmed and urban landscape, and the fence is the shoreline of that island.
Wilkinson, McInturff, Kelly and Brashares — "Quantifying wildlife responses to conservation fencing in East Africa", Biological Conservation 256, 109071 (2021)
Read 28 September 2026 from the University of California eScholarship copy. A year of camera trapping on the Lake Nakuru perimeter fence itself, and the single best source on what the fence here actually does. Findings used: the park is 188 square kilometres, the lake covers nearly a third of it and the land area is about 135 square kilometres; the park lies directly west of the 190-square-kilometre Soysambu Conservancy, a partly fenced private reserve and working ranch carrying 10,000 sheep, goats and cattle; Nakuru city sits directly north and had a population of 570,000 in 2019; four rivers enter the park, three from the south and one from the north-west; and wildlife density inside the park is at least 20 per cent higher than on the community land outside it. On the fence: 19 cameras recorded 65,560 photographs of mammals and 3,626 crossings over 2,818 trap nights, 38 wild mammal species approached known weak points, 27 of them were recorded crossing, every large carnivore species in the park crossed, and repaired gaps were breached again within days.
https://doi.org/10.1016/j.biocon.2021.109071