
Kenya / Lake Nakuru / Wildlife — Lake Nakuru
Wildlife — Lake Nakuru
Lake Nakuru is still sold on a photograph taken before 2010. The birds in it have largely gone, the reason is documented, and the park has a better answer than the one it is still being marketed on.
The flamingos: what actually happened
Lake Nakuru was, for most of the second half of the twentieth century, one of the great wildlife spectacles on earth: a shallow soda lake carrying a pink band of lesser flamingos that was regularly described in the millions. The peer-reviewed literature puts it plainly — Nakuru is "one of the most important Flamingo feeding lakes in East Africa, historically supporting over one million birds at a time". That is the past tense in a scientific paper, and it is the honest starting point for this page.
What happened is not poaching, not pollution and not development. It is water. Lake levels across the Kenyan Rift began rising abruptly from around 2010 and rose faster again from 2020. Lake Nakuru's surface area in December 2020 was 70 per cent larger than its 1984-2009 average; measured from 2009 to 2022 it grew by 90.7 per cent. A shallow alkaline lake in a flat basin does not simply get bigger when this happens. It gets diluted.
The lake, then and now
| Measure | Value | Period |
|---|---|---|
| Surface area against the 1984-2009 mean | 70 per cent larger | December 2020 |
| Surface area change | Up 90.7 per cent | 2009 to 2022 |
| Largest mean annual area on record | 62.3 km2 | 2020 |
| Range between lowest and highest water level | 6.40 m | Whole satellite record |
| Mean chlorophyll-a, the measure of flamingo food in the water | From more than 400 to less than 200 mg per cubic metre | Across the study period to 2022 |
| Threshold for high-quality flamingo feeding water | 355 mg per cubic metre | As defined in the 2024 study |
The last two rows are the whole story in two lines. The food in the water fell from comfortably above the threshold to comfortably below it.
What we are deliberately not telling you
A current flamingo count. None of the sources we read publishes one for Lake Nakuru in 2025 or 2026, counts of this species are irregular and highly variable between surveys, and a number invented to fill the gap would be the single most quotable wrong thing on this site. The birds are not gone. They are massively reduced against the historic spectacle and they vary from week to week. That is as precise as the published evidence allows anyone to be, and anyone being more precise is not working from it.
Byrne, Tebbs, Njoroge, Nkwabi, Chadwick, Freeman and Norris — "Productivity declines threaten East African soda lakes and the iconic Lesser Flamingo", Current Biology 34, 1786-1793 (22 April 2024)
Read 28 September 2026 from the open-access version of record. This is the paper that settles the flamingo question, and it is the reason this park's wildlife page reads the way it does. The authors combined satellite Earth observation with flamingo count data across 22 East African soda lakes from 1999 to 2022. Findings used here: lake surface areas across the 22 lakes rose by an average of 0.32 square kilometres a year; chlorophyll-a — the measure of the phytoplankton the birds eat — fell by 3.9 mg per cubic metre a year; 18 of the 22 lakes were at their least productive when their surface area was greatest; Lake Nakuru grew in surface area by 90.7 per cent between 2009 and 2022 and its mean chlorophyll-a fell from more than 400 mg per cubic metre to less than 200; the threshold the authors use for high-quality feeding water is 355 mg per cubic metre, which corresponds to an Arthrospira fusiformis density of 50 mg dry weight per litre; and at Bogoria and Nakuru the loss of high-quality feeding habitat since 2010 coincided with declining flamingo numbers. The paper describes Nakuru as "one of the most important Flamingo feeding lakes in East Africa, historically supporting over one million birds at a time". It does not give a current Nakuru count, and neither do we.
https://doi.org/10.1016/j.cub.2024.03.006Herrnegger, Stecher, Schwatke and Olang — "Hydroclimatic analysis of rising water levels in the Great Rift Valley Lakes of Kenya", Journal of Hydrology: Regional Studies 36, 100857 (25 June 2021)
Read 28 September 2026 from the open-access copy deposited on EarthArXiv, the published paper being behind a paywall at the publisher. Findings used here: Lake Nakuru's surface area in December 2020 was 70 per cent larger than its 1984-2009 mean; its largest mean annual area over the record was 62.3 square kilometres at a level of 1766.2 metres, in 2020; the total range between its lowest and highest recorded water level is 6.40 metres; the catchment is 1,471 square kilometres with a mean annual rainfall of 1,013 mm over 1981-2020, rising by about 20 per cent, or 193 mm, in the eleven years after 2009; the lake is fed by the Baharini spring on its eastern shore, the permanent Ngosur river and four seasonal rivers — the Njoro, Nderit, Makalia and Lamudhiak, all rising in the Eastern Mau forest. The paper states that the rise "changed the water quality of the normally alkaline-saline lake, leading to loss of the algae abundance. In consequence, a vast number of Flamingos have left." It also records, citing Onywere and others (2013), that flood inundation left about 60 per cent of the park inaccessible, and, citing Obando and others (2016), that the main administrative block was flooded.
https://doi.org/10.1016/j.ejrh.2021.100857The mechanism, in one paragraph of chemistry
Lesser flamingos are specialists. The great majority of their diet is a single cyanobacterium, Arthrospira fusiformis, which they filter out of the water with a bill built for the job. That organism thrives in conditions almost nothing else tolerates: a salinity of roughly 20 to 70 grams of salt per litre and a pH of around 9. Soda lakes are endorheic — water flows in and evaporates out, with no river draining them — so salts concentrate and the chemistry holds.
Add a sustained rainfall surplus and the mechanism runs in reverse. More fresh water arrives, the lake deepens and spreads, the salts are diluted, salinity and pH fall out of the window Arthrospira needs, and the bloom thins. The birds, which need to spend around 90 per cent of their time feeding in water carrying about 50 mg dry weight of Arthrospira per litre simply to meet their energy requirements, run out of food and leave. It is a two-step food chain and it snaps at the bottom.
The scale of change needed is smaller than anyone expects
The hydrological work on the Rift lakes found that an increase equivalent to around 0.4 to 2 per cent of pre-rise annual rainfall is enough to explain the entire rise in lake levels. Catchment rainfall at Nakuru rose about 20 per cent over 2010-2020 against the previous quarter century, which is far more than was needed. This is a system that was sitting close to a threshold, and it went over it.
Two further complications belong here rather than in a footnote. Older published work — separate studies of Nakuru's surface area between 1984 and 2013 — found no direct correlation between rainfall and lake area at all, which is a reminder that this was contested before the 2020 flood made it obvious. And the salinity figures for Nakuru in the literature do not agree with each other: one study reports conductivity up to 160,000 microsiemens per centimetre without giving a date for the reading, another reports 49,000. Both are in the record, both are cited in the same review, and we are not going to pick between them.
Byrne, Tebbs, Njoroge, Nkwabi, Chadwick, Freeman and Norris — "Productivity declines threaten East African soda lakes and the iconic Lesser Flamingo", Current Biology 34, 1786-1793 (22 April 2024)
Read 28 September 2026 from the open-access version of record. This is the paper that settles the flamingo question, and it is the reason this park's wildlife page reads the way it does. The authors combined satellite Earth observation with flamingo count data across 22 East African soda lakes from 1999 to 2022. Findings used here: lake surface areas across the 22 lakes rose by an average of 0.32 square kilometres a year; chlorophyll-a — the measure of the phytoplankton the birds eat — fell by 3.9 mg per cubic metre a year; 18 of the 22 lakes were at their least productive when their surface area was greatest; Lake Nakuru grew in surface area by 90.7 per cent between 2009 and 2022 and its mean chlorophyll-a fell from more than 400 mg per cubic metre to less than 200; the threshold the authors use for high-quality feeding water is 355 mg per cubic metre, which corresponds to an Arthrospira fusiformis density of 50 mg dry weight per litre; and at Bogoria and Nakuru the loss of high-quality feeding habitat since 2010 coincided with declining flamingo numbers. The paper describes Nakuru as "one of the most important Flamingo feeding lakes in East Africa, historically supporting over one million birds at a time". It does not give a current Nakuru count, and neither do we.
https://doi.org/10.1016/j.cub.2024.03.006Herrnegger, Stecher, Schwatke and Olang — "Hydroclimatic analysis of rising water levels in the Great Rift Valley Lakes of Kenya", Journal of Hydrology: Regional Studies 36, 100857 (25 June 2021)
Read 28 September 2026 from the open-access copy deposited on EarthArXiv, the published paper being behind a paywall at the publisher. Findings used here: Lake Nakuru's surface area in December 2020 was 70 per cent larger than its 1984-2009 mean; its largest mean annual area over the record was 62.3 square kilometres at a level of 1766.2 metres, in 2020; the total range between its lowest and highest recorded water level is 6.40 metres; the catchment is 1,471 square kilometres with a mean annual rainfall of 1,013 mm over 1981-2020, rising by about 20 per cent, or 193 mm, in the eleven years after 2009; the lake is fed by the Baharini spring on its eastern shore, the permanent Ngosur river and four seasonal rivers — the Njoro, Nderit, Makalia and Lamudhiak, all rising in the Eastern Mau forest. The paper states that the rise "changed the water quality of the normally alkaline-saline lake, leading to loss of the algae abundance. In consequence, a vast number of Flamingos have left." It also records, citing Onywere and others (2013), that flood inundation left about 60 per cent of the park inaccessible, and, citing Obando and others (2016), that the main administrative block was flooded.
https://doi.org/10.1016/j.ejrh.2021.100857Where the birds went, and why we will not be confident about it
The standard answer, repeated across travel writing and by operators who have adapted their pitch, is that the flamingos moved to Lake Bogoria and Lake Elementaita. Neither of those lakes has a page on this site. Both are worth naming. But the evidence does not support that answer as cleanly as it is usually given, and this is the part of the flamingo story that gets told wrong in the other direction.
- Lake Bogoria is not a refuge in the simple sense. The same 2024 study found that at Bogoria, as at Nakuru, declines in high-quality feeding habitat since 2010 coincided with declining flamingo numbers. Bogoria is a deep lake in a steep depression, so its surface area barely moved — up around 28 per cent — but its food supply still fell.
- Lake Elementaita is one of only three water bodies across the whole 22-lake study where the area of high-quality feeding habitat increased between 2010 and 2022, and the only one of the three anywhere near Nakuru. On the published evidence it is the best-supported of the two usual answers.
- The other two gainers, Chew Bahir in southern Ethiopia and Eyasi in northern Tanzania, are large shallow seasonal lakes far outside any Rift Valley circuit.
- Lake Natron in Tanzania, the only regular breeding site for the species in East Africa, is itself losing productivity as its water level rises. That is the part of this story with the longest consequences.
The honest limitation, in the authors' own terms
The 2024 study states directly that because most of its count data came from Bogoria and Nakuru, "the count data were not sufficient to quantify Flamingo distribution shifts linked to declining habitat suitability". In other words: the science can show the food collapsing at Nakuru and the birds declining there. It cannot yet show, from counts, where they went. Anybody telling you confidently that the Nakuru flock is now at Bogoria is going beyond the published evidence.
The wider picture is not reassuring. More than three-quarters of the world's lesser flamingos live on East African soda lakes, populations are in decline, and phytoplankton biomass fell across all 22 lakes studied at an average of 3.9 mg of chlorophyll-a per cubic metre per year between 1999 and 2022. Rainfall in East Africa is projected to increase under climate change. This is not a bird that moved house. It is a habitat network contracting.
Byrne, Tebbs, Njoroge, Nkwabi, Chadwick, Freeman and Norris — "Productivity declines threaten East African soda lakes and the iconic Lesser Flamingo", Current Biology 34, 1786-1793 (22 April 2024)
Read 28 September 2026 from the open-access version of record. This is the paper that settles the flamingo question, and it is the reason this park's wildlife page reads the way it does. The authors combined satellite Earth observation with flamingo count data across 22 East African soda lakes from 1999 to 2022. Findings used here: lake surface areas across the 22 lakes rose by an average of 0.32 square kilometres a year; chlorophyll-a — the measure of the phytoplankton the birds eat — fell by 3.9 mg per cubic metre a year; 18 of the 22 lakes were at their least productive when their surface area was greatest; Lake Nakuru grew in surface area by 90.7 per cent between 2009 and 2022 and its mean chlorophyll-a fell from more than 400 mg per cubic metre to less than 200; the threshold the authors use for high-quality feeding water is 355 mg per cubic metre, which corresponds to an Arthrospira fusiformis density of 50 mg dry weight per litre; and at Bogoria and Nakuru the loss of high-quality feeding habitat since 2010 coincided with declining flamingo numbers. The paper describes Nakuru as "one of the most important Flamingo feeding lakes in East Africa, historically supporting over one million birds at a time". It does not give a current Nakuru count, and neither do we.
https://doi.org/10.1016/j.cub.2024.03.006Rhino: the honest reason to come now
Lake Nakuru holds both African rhino species and they are the most reliable rhino viewing in Kenya. That is not a marketing sentence; it is what a fenced 188-square-kilometre park with a four-decade sanctuary programme produces. If you want to see rhino in Kenya and you have one day, this is where you go.
The history is well documented. Formal protection began in 1961, when the southern tip of the lake was declared a bird sanctuary; the sanctuary was extended over the whole lake in 1964; the area was gazetted as a national park in 1968 at about 6,000 hectares; and it was expanded with World Wide Fund for Nature support in 1974 to its present 188 square kilometres. The electric perimeter fence went up in 1986, and in 1987 Lake Nakuru became Kenya's first government-managed rhino sanctuary. A contemporary account in Oryx records the founding: the Rhino Rescue Charitable Appeal Trust was formed in England in 1985, work began within a year, and when the sanctuary opened in 1987, 17 rhinos from Courtland Parfet's private ranch at Solio joined the two animals already in the park, with a further 11 females to follow.
Why this page publishes no rhino population figure
Because KWS does not publish one, and the reason it does not publish one is security. Rhino numbers by site are poaching intelligence. Every Kenyan source we read behaves the same way: the department's own park page says the park supports "one of the country's largest populations of black rhinos, and white rhinos" and stops there; the genetics paper that sequenced this very subpopulation gives no census. A figure quoted to you for Lake Nakuru's rhino did not come from the department. We would rather be the site that says so than the site that repeats it.
One published finding about this population is worth knowing, because it is what a fence does over time. A 2019 study of the mitochondrial control region found the Lake Nakuru black rhino subpopulation carries slightly lower genetic diversity than the pooled Kenyan population, with founders drawn from several source subpopulations. A closed sanctuary saves animals and narrows a gene pool, and both of those things are true of this park.
Lever — "Lake Nakuru Black Rhinoceros Sanctuary", Oryx 24(2), 90-94 (April 1990)
Read 28 September 2026. A contemporary account of how the sanctuary was founded, by a trustee of the trust that funded it. The Rhino Rescue Charitable Appeal Trust was formed in England in 1985; work on the first sanctuary, at Lake Nakuru, began within a year; the sanctuary opened in 1987, when 17 rhinos from Courtland Parfet's private ranch at Solio joined the two animals already in the park, with a further 11 females due to follow. The article is 36 years old and is used here for the founding history only. No current population figure is taken from it or from anywhere else.
https://doi.org/10.1017/s0030605300034736Thuo, Kamau, Kariuki, Kibegwa and Kimiti — "Genetic assessment of a breeding population of black rhinoceros in Kenya using mitochondrial DNA D-loop sequencing", Genetics and Molecular Research 18(2) (2019)
Read 28 September 2026. The study sequenced a 469-base-pair stretch of the mitochondrial control region, found 7.11 per cent of sites variable and 18 distinct haplotypes, and concluded that the Lake Nakuru black rhino subpopulation carries slightly lower genetic diversity than the pooled Kenyan population, with founders probably drawn from several source subpopulations. It gives no census figure, which is consistent with every other published Kenyan source on this species.
https://doi.org/10.4238/gmr18203Kenya Wildlife Service — Lake Nakuru National Park
Read 28 September 2026. This is the department's own park page, and on this date it answered — which is worth recording, because kws.go.ke refuses automated requests often enough that other Kenyan parks on this site carry their figures as "read failed, carried from record". The page gives the park history to the year, the gate list, the distance from Nairobi, the accommodation list, the gate hours and the in-park rules, and it prints the same four-band conservation fee as the national schedule. It does not give a rhino population, a flamingo count or a drive time, and neither does this page.
https://kws.go.ke/park/lake-nakuru-national-park/The giraffe, and the lesson of the 2002 crash
Lake Nakuru's giraffe are the animals most often sold as Rothschild's giraffe, translocated here because the subspecies had been reduced to a handful of protected populations. Current taxonomy treats them as Nubian giraffe, Giraffa camelopardalis camelopardalis, and the most recent study carried out in this park uses that name. A 2009 paper listed five viable Rothschild's populations at the time: Murchison Falls in Uganda, and Lake Nakuru, Ruma, Giraffe Manor and Mwea in Kenya. Lake Nakuru's place in that list is the reason the animals are here.
That same paper is the most useful thing published about this park's ecology, and it is not a happy story. Kenya Wildlife Service queried a fall in the park's giraffe from 153 individuals in 1995 to 62 in 2002, together with a failure to recruit young over those years. Genetic analysis ruled out inbreeding as the explanation. The authors instead linked the crash to the drought attributed to the 1994 El Nino, and suggested that heavily concentrated tannins from forced over-consumption of the park's declining acacias may have compromised young animals and left them easy prey for the park's lions.
The title of that paper is the point
"Implications of closed ecosystem conservation management". A fenced park cannot let its browsers walk away from a bad year. When the acacia thins, the giraffe over-consume what is left, and nothing moves out. This is the cost side of the fence, stated by researchers twenty-four years ago, in a park where the land area has since been reduced further by a rising lake and where the acacia woodland has continued to decline.
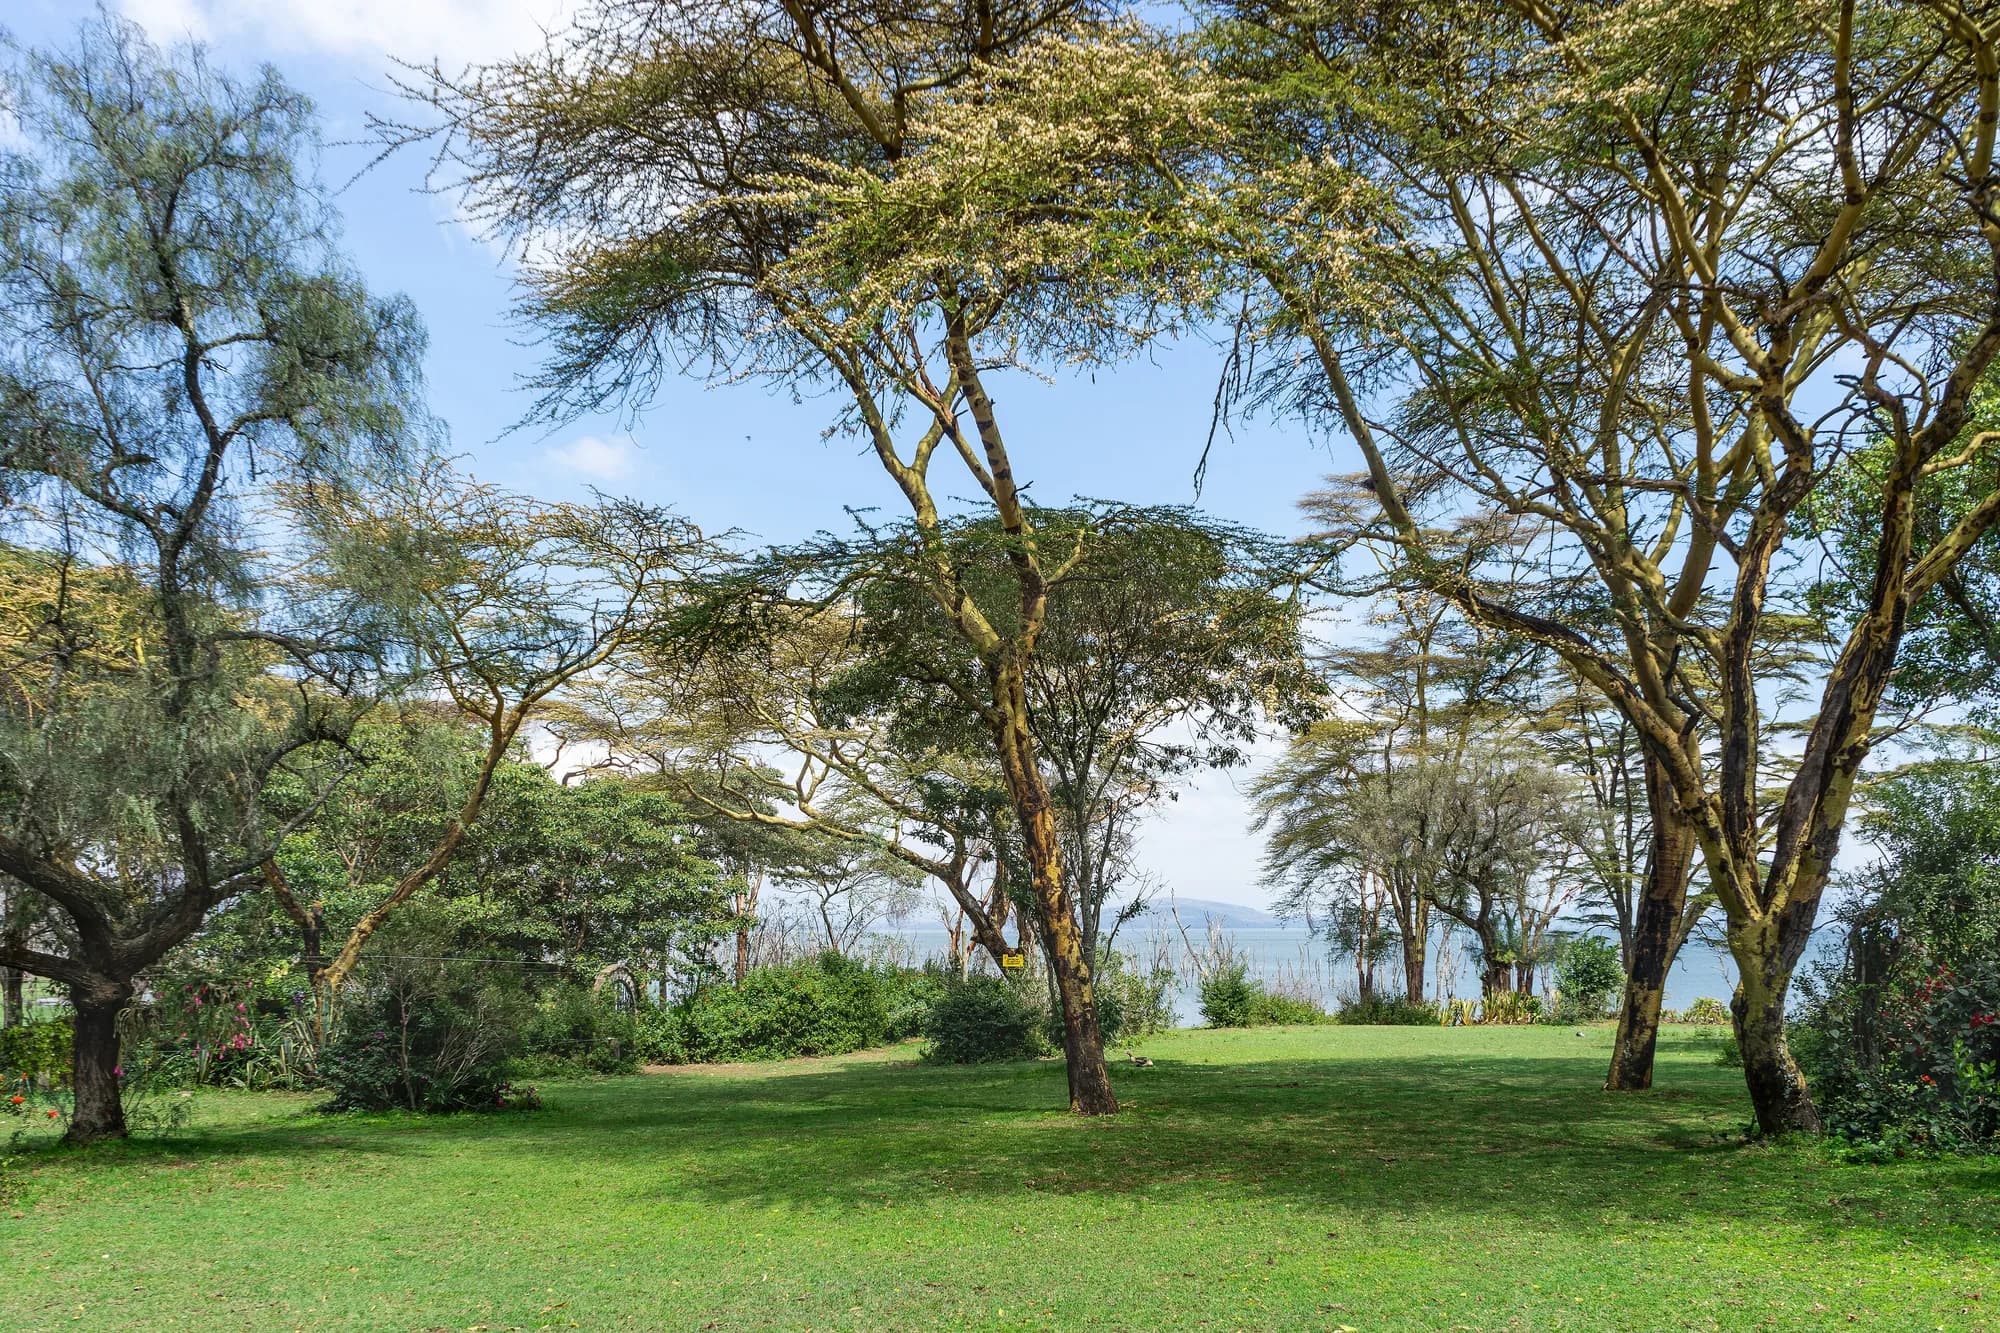
What you will actually see is straightforward. The giraffe here are in the fever tree woodland, and the recent study puts numbers on that: Vachellia xanthophloea, the yellow-barked fever tree, accounted for 67 per cent of all giraffe foraging records, 4,136 out of 6,215 observations. Find the pale-trunked stands and you are looking in the right place.
Brenneman, Bagine, Brown, Ndetei and Louis — "Implications of closed ecosystem conservation management: the decline of Rothschild's giraffe in Lake Nakuru National Park, Kenya", African Journal of Ecology 47(4), 711-719 (2009)
Read 28 September 2026. The paper records that Kenya Wildlife Service queried a fall in the park's giraffe from 153 individuals in 1995 to 62 in 2002, together with a failure to recruit young over those years. Genetic analysis found the population in good health with respect to inbreeding, so that explanation was ruled out. The authors link the decline instead to the drought attributed to the 1994 El Nino, and suggest that heavily concentrated tannins from forced over-consumption of the park's declining acacias may have compromised young animals and made them easy prey for the park's lions. The paper lists five viable Rothschild's populations at the time: Murchison Falls in Uganda, and Lake Nakuru, Ruma, Giraffe Manor and Mwea in Kenya.
https://doi.org/10.1111/j.1365-2028.2008.01029.xGitau, Mbau, Ngugi, Ngumbi and Muneza — "Activity budget and foraging patterns of Nubian giraffe in Lake Nakuru National Park, Kenya", Ecology and Evolution 14(6), e11463 (30 May 2024)
Read 28 September 2026 from the abstract of record; the publisher refused the full text to an automated request on the same day. The study recorded 11,280 giraffe activities in the park, 4,560 in the dry season and 6,720 in the wet. Foraging took 53 per cent of the dry-season budget and 57 per cent of the wet-season one. The figure quoted on these pages is the diet: Vachellia xanthophloea, the yellow-barked fever tree, accounted for 67 per cent of foraging records, 4,136 out of 6,215. Note also the name the paper uses. The animal this park is famous for is still widely sold as Rothschild's giraffe; current taxonomy treats it as the Nubian giraffe, Giraffa camelopardalis camelopardalis, and this paper is written that way.
https://doi.org/10.1002/ece3.11463Lion, leopard and what a fence concentrates
Lake Nakuru has lions, and they matter here beyond the tick on a list — the 2009 giraffe paper implicated them directly in the failure of that population to recruit young, which is what predation looks like in a closed system where prey cannot disperse. The park also has leopard in the woodland and along the escarpment. We publish no population figure for either, because no source we read this session gives one.
For everything else, the most useful published inventory is an unexpected one: the camera-trap study of the perimeter fence recorded 38 wild mammal species approaching known weak points over a single year, across ungulates, primates, carnivores, aardvark, hares and rodents. That is a measure of what lives in and around the park, gathered at the one place where everything has a reason to turn up.
The density is the point, not the list
Wildlife density inside the fence is at least 20 per cent higher than on the community land outside it. In a park of 188 square kilometres, a third of it water, that concentration is what makes a short visit productive — you are not searching a wilderness. Note the counterweight from the same paper: the neighbouring Soysambu Conservancy holds higher populations of most ungulates than the national park does.
Wilkinson, McInturff, Kelly and Brashares — "Quantifying wildlife responses to conservation fencing in East Africa", Biological Conservation 256, 109071 (2021)
Read 28 September 2026 from the University of California eScholarship copy. A year of camera trapping on the Lake Nakuru perimeter fence itself, and the single best source on what the fence here actually does. Findings used: the park is 188 square kilometres, the lake covers nearly a third of it and the land area is about 135 square kilometres; the park lies directly west of the 190-square-kilometre Soysambu Conservancy, a partly fenced private reserve and working ranch carrying 10,000 sheep, goats and cattle; Nakuru city sits directly north and had a population of 570,000 in 2019; four rivers enter the park, three from the south and one from the north-west; and wildlife density inside the park is at least 20 per cent higher than on the community land outside it. On the fence: 19 cameras recorded 65,560 photographs of mammals and 3,626 crossings over 2,818 trap nights, 38 wild mammal species approached known weak points, 27 of them were recorded crossing, every large carnivore species in the park crossed, and repaired gaps were breached again within days.
https://doi.org/10.1016/j.biocon.2021.109071The birds that are not flamingos
Kenya Wildlife Service describes the park as "an ornithological paradise hosting approximately 450 bird species", and that figure is the department's own. It is also the part of Lake Nakuru's reputation that the flooding has damaged least, because a bigger lake is still a lake and the woodland, escarpment and riverine habitats behind it are untouched by the water.
Both flamingo species occur here: the lesser flamingo, which is the one the spectacle was built on and which feeds on cyanobacteria, and the greater flamingo, which is a larger bird with a different diet and different tolerances. They are routinely conflated in travel writing and they are not interchangeable — the collapse documented above is specifically a lesser flamingo story.
What a birder should actually expect
Four hundred and fifty species is a serious list and it is not contingent on the lake's chemistry. If birds rather than the flamingo spectacle are why you are coming, Lake Nakuru remains a strong day, and the woodland and escarpment are where to spend it rather than the shoreline. If the flamingo spectacle specifically is why you are coming, the section above applies and no amount of birdlife elsewhere in the park substitutes for it.
Kenya Wildlife Service — Lake Nakuru National Park
Read 28 September 2026. This is the department's own park page, and on this date it answered — which is worth recording, because kws.go.ke refuses automated requests often enough that other Kenyan parks on this site carry their figures as "read failed, carried from record". The page gives the park history to the year, the gate list, the distance from Nairobi, the accommodation list, the gate hours and the in-park rules, and it prints the same four-band conservation fee as the national schedule. It does not give a rhino population, a flamingo count or a drive time, and neither does this page.
https://kws.go.ke/park/lake-nakuru-national-park/