
Zambia / South Luangwa / Wildlife — South Luangwa
Wildlife — South Luangwa
One peer-reviewed leopard density estimate exists for this park. It is a good number, it was produced with Zambian departmental co-authorship, and it does not say what almost everybody quoting it thinks it says.
The leopard number, in full
In 2016 a team led by Elias Rosenblatt, with Scott Creel, Matthew Becker, Johnathan Reyes de Merkle, Henry Mwape, Paul Schuette and Twakundine Simpamba, published the only rigorous leopard density estimate for South Luangwa. Two matched camera grids either side of the Luangwa, 25 and 26 unbaited double-camera stations on a randomised 2.5 km grid, five dry seasons between 2012 and 2014, closed robust-design capture-recapture with individuals identified from spot patterns. The paper is open access and one of its authors is an officer of Zambia's own department.
Leopard density across the South Luangwa protection gradient, 2012-2014
| Grid | Where | Density per 100 km2 | 95% confidence interval |
|---|---|---|---|
| Western study area, 172 km2 | Inside the National Park, west bank, between the seasonal Katete and Luwi rivers, within 6 km of the Luangwa | 8.50 | 7.52 - 9.48 |
| Eastern study area, 141 km2 | East bank, between the seasonal Mwangazi and the spring-fed Chichele stream; part Nsefu sector, part Lupande GMA | 5.08 | 3.83 - 6.34 |
Density inside the park is 67 per cent higher than on the eastern grid. Annual survival did not detectably differ between the two, and temporary emigration was low. The authors read the gap as prey depletion driven by bushmeat snaring rather than as leopards being killed outside the park.
What the paper says about its own standing
"These are the first methodologically and statistically rigorous estimates of leopard density and survival in a population considered critical for regional carnivore conservation." First, in 2016. Any claim about South Luangwa's leopard density made before that date was made without a rigorous estimate to make it from.
Rosenblatt, Creel, Becker, Merkle, Mwape, Schuette and Simpamba — "Effects of a protection gradient on carnivore density and survival: an example with leopards in the Luangwa valley, Zambia", Ecology and Evolution 6(11): 3772-3785 (5 May 2016)
Read 28 September 2026, in full, from the PubMed Central copy. Open access, peer reviewed, and co-authored with an officer of Zambia's own department. Camera traps on two matched grids either side of the Luangwa River across five dry seasons from 2012 to 2014, analysed with closed robust-design capture-recapture. It is the only rigorous leopard density estimate for this park that we could find, and the paper says as much about itself: these are "the first methodologically and statistically rigorous estimates of leopard density and survival" in the population. It is also the source for the park's area as the researchers state it (9,050 km2), the Lupande GMA area (5,660 km2) and the snare-occurrence comparison.
https://pmc.ncbi.nlm.nih.gov/articles/PMC4864144/The highest concentration of leopard in Africa — we cannot support it
Our own park record for South Luangwa calls it "the highest concentration of leopard in Africa". We went looking for the evidence and could not find any. The one measured figure for this park is 8.50 leopards per 100 km2 inside the National Park, with an upper confidence bound of 9.48. A 2025 study of the greater Kruger region, using multi-session spatial capture-recapture across central and southern Kruger, Sabi Sand and Karingani, reports densities ranging from 2.6 plus or minus 0.6 up to 13.2 plus or minus 2.6 leopards per 100 km2. The top of that range sits above the top of South Luangwa's confidence interval.
The comparison, with the caveats attached
| Site | Density per 100 km2 | Method | Year |
|---|---|---|---|
| South Luangwa NP, western grid | 8.50 (CI 7.52-9.48) | Closed robust-design capture-recapture, area estimated by half mean maximum distance moved | 2012-2014 data, published 2016 |
| Eastern grid, Nsefu and Lupande | 5.08 (CI 3.83-6.34) | Same | 2013-2014 data, published 2016 |
| Greater Kruger region, ten surveys | 2.6 +/- 0.6 to 13.2 +/- 2.6 | Multi-session spatial capture-recapture | Published 2025 |
These are not like-for-like. The Luangwa authors chose not to use spatially explicit capture-recapture and said so, and warned in terms that their method choice "is relevant only for comparisons of our density estimates to those from other studies". So the comparison above is indicative rather than decisive — which is precisely the point. A superlative about the whole continent cannot rest on a comparison the authors themselves flagged as the weak part of their design.
What we would say instead
South Luangwa carries a high, measured, well-protected leopard density and is among the most reliable places in Africa to see one, largely because Zambia permits night driving and the river concentrates the animals. That is a strong claim, it is defensible, and it is the one this site should be making. "The highest in Africa" is not defensible on any source we could reach, and our park record should be changed.
Rosenblatt, Creel, Becker, Merkle, Mwape, Schuette and Simpamba — "Effects of a protection gradient on carnivore density and survival: an example with leopards in the Luangwa valley, Zambia", Ecology and Evolution 6(11): 3772-3785 (5 May 2016)
Read 28 September 2026, in full, from the PubMed Central copy. Open access, peer reviewed, and co-authored with an officer of Zambia's own department. Camera traps on two matched grids either side of the Luangwa River across five dry seasons from 2012 to 2014, analysed with closed robust-design capture-recapture. It is the only rigorous leopard density estimate for this park that we could find, and the paper says as much about itself: these are "the first methodologically and statistically rigorous estimates of leopard density and survival" in the population. It is also the source for the park's area as the researchers state it (9,050 km2), the Lupande GMA area (5,660 km2) and the snare-occurrence comparison.
https://pmc.ncbi.nlm.nih.gov/articles/PMC4864144/"Counting spots: Leopard density along a gradient of conservation rigor", Conservation Science and Practice (2025)
Abstract read 28 September 2026 via the OpenAlex record; the publisher's full text was refused with HTTP 403. Ten camera-trap surveys across central and southern Kruger National Park, Sabi Sand Game Reserve and Karingani Game Reserve, analysed with multi-session spatial capture-recapture. Reported densities range from 2.6 +/- 0.6 to 13.2 +/- 2.6 leopards per 100 km2. We use it here only as the comparison that a claim about Africa's highest leopard density has to survive, and we flag that its method is not the method used in the Luangwa.
https://conbio.onlinelibrary.wiley.com/doi/10.1111/csp2.70197The citation everybody is quoting does not exist
Trace the leopard-density claim back and it tends to arrive at Wikipedia's Nsefu Sector section, which says the area "supports some of the highest recorded densities of leopards in southern Africa" and hangs the sentence on two references. We checked both.
The two citations behind the claim
| Reference as given | What we found |
|---|---|
| Thirgood, S. et al., "The Dynamics of Wildlife in South Luangwa National Park", African Journal of Ecology 45.4 (2007): 676-685 | No such record in Crossref. We then listed Crossref's index of African Journal of Ecology volume 45, issue 4, and the articles at and around those page numbers are by other authors on other subjects. Simon Thirgood's indexed work from that period is on human-wildlife conflict and disease, not on Luangwa wildlife dynamics |
| Purchase, G. & Mateke, C., "Status and Distribution of Large Carnivores in the Luangwa Valley", Zambian Carnivore Programme Report (2012) | No public copy found. Purchase and Mateke have genuinely written on Zambian carnivore status, so this may be a real but unpublished report with the title or year slightly wrong; we could not verify it either way |
Crossref is not a perfect index and the absence of a record is not absolute proof that a paper does not exist. But a 2007 article in a major Wiley journal that Crossref has never heard of, at page numbers that Crossref assigns to other papers, is as close to negative evidence as this kind of check gets.
Why this belongs on a wildlife page
Because the superlative on a hundred safari websites is downstream of those two lines, and one of them appears to be fictitious. The real number is better than nothing, it is public, it was produced with Zambian government involvement, and nobody quotes it.
Wikipedia — South Luangwa National Park (article and wikitext)
Read 28 September 2026, including the raw wikitext. Relevant because it is where most repetitions of the leopard-density claim ultimately lead. Its Nsefu Sector section states that the area "supports some of the highest recorded densities of leopards in southern Africa" and hangs that on two references. We could not verify either: the first, given as Thirgood et al., "The Dynamics of Wildlife in South Luangwa National Park", African Journal of Ecology 45.4 (2007): 676-685, returns nothing in Crossref, and Crossref's own index of that journal issue contains no article by those authors at those pages. The second is a 2012 Zambian Carnivore Programme report for which we found no public copy. The article's founding dates — a 1904 game reserve and a 1938 one — both carry citation-needed tags.
https://en.wikipedia.org/wiki/South_Luangwa_National_ParkThe prey base, which is the actual explanation
Leopard density here is a consequence of impala, puku, zebra and warthog, and those were measured too. A 2019 PLOS ONE study by an overlapping team ran distance sampling on 15 vehicle transects totalling 120.5 km across the same protection gradient, 2012 to 2015, and found all four species between 4.5 and 13.2 times denser inside the park than in the partially protected buffer beside it.
The four species counted, and what the sampling found
| Species | Mean herd size recorded | Range |
|---|---|---|
| Impala (Aepyceros melampus) | 7.1 individuals | 1 - 75 |
| Puku (Kobus vardonii) | 6.6 individuals | 1 - 111 |
| Plains zebra (Equus quagga) | 5.1 individuals | 1 - 24 |
| Warthog (Phacochoerus africanus) | 2.6 individuals | 1 - 9 |
Herd sizes are from the subsets used in the herd-size analysis after truncation, not from the full detection set. The paper's headline result is the density gap across the protection gradient, not these means.
The snare number is the one to remember
Median probability of a wire snare being present was 0.74 on the east-bank grid against 0.14 inside the park — 5.2 times greater. Herbivore biomass in Lupande GMA has been estimated at a tenth of capacity. That is why the leopard density falls off a cliff across a river the leopards themselves cross freely.
Rosenblatt et al. — "Do protection gradients explain patterns in herbivore densities? An example with ungulates in Zambia's Luangwa Valley", PLOS ONE 14(10): e0224438 (30 October 2019)
Read 28 September 2026. The prey-side companion to the leopard study, by an overlapping team on the same protection gradient. Distance sampling on 15 vehicle transects totalling 120.5 km, 2012 to 2015, for impala, puku, plains zebra and warthog. It is the source for the statement that all four species sit between 4.5 and 13.2 times denser inside the park than in the adjoining partially protected land, and for the 2013-2014 national hunting moratorium.
https://journals.plos.org/plosone/article?id=10.1371/journal.pone.0224438Rosenblatt, Creel, Becker, Merkle, Mwape, Schuette and Simpamba — "Effects of a protection gradient on carnivore density and survival: an example with leopards in the Luangwa valley, Zambia", Ecology and Evolution 6(11): 3772-3785 (5 May 2016)
Read 28 September 2026, in full, from the PubMed Central copy. Open access, peer reviewed, and co-authored with an officer of Zambia's own department. Camera traps on two matched grids either side of the Luangwa River across five dry seasons from 2012 to 2014, analysed with closed robust-design capture-recapture. It is the only rigorous leopard density estimate for this park that we could find, and the paper says as much about itself: these are "the first methodologically and statistically rigorous estimates of leopard density and survival" in the population. It is also the source for the park's area as the researchers state it (9,050 km2), the Lupande GMA area (5,660 km2) and the snare-occurrence comparison.
https://pmc.ncbi.nlm.nih.gov/articles/PMC4864144/Thornicroft's giraffe, and a taxonomy that is not settled
The Luangwa Valley has its own giraffe, and what to call it is genuinely contested. Under the arrangement the IUCN Red List has used, giraffe are a single species, Giraffa camelopardalis, with subspecies, and the Luangwa animal is Giraffa camelopardalis thornicrofti — Thornicroft's giraffe, sometimes Rhodesian giraffe. Under the arrangement advanced by the Giraffe Conservation Foundation and its research partners, there are four giraffe species, and the Luangwa animal becomes a subspecies of the Masai giraffe: Giraffa tippelskirchi thornicrofti. GCF's own species page now calls it the Luangwa giraffe and gives a population of 764.
The same animal, three names
| Arrangement | Name | Rank |
|---|---|---|
| One species with subspecies, as long used by the IUCN Red List | Giraffa camelopardalis thornicrofti — Thornicroft's giraffe | Subspecies of the single giraffe species |
| Four species, as advanced by GCF and partners | Giraffa tippelskirchi thornicrofti — Luangwa giraffe | Subspecies of the Masai giraffe |
| This site's own species slug | thornicrofts-giraffe | Follows the older, still widely used name |
GCF states the four-species arrangement as established and does not set out the competing view on the page we read. We are not taking a side. We are telling you that a guide who says Thornicroft's and a paper that says Luangwa giraffe are talking about the same animals, and that the population figure attached to it — 764 — comes from the organisation advocating the split.
Endemic, and what that is worth
Whatever its rank, this population is confined to the Luangwa Valley, and 764 animals is not many. Wikipedia's own article, incidentally, names the park's giraffe as Rhodesian giraffe, which is a third name for the same taxon and a small illustration of how muddled the public record is. Cookson's wildebeest and Crawshay's zebra are the valley's other endemic or near-endemic large mammals.
Giraffe Conservation Foundation — Giraffe species
Read 28 September 2026. GCF splits giraffe into four species and places the Luangwa animal as a subspecies of the Masai giraffe, written Giraffa tippelskirchi thornicrofti and named on the page as "Luangwa giraffe", with a population of 764. GCF is an advocate for the four-species arrangement, states it as settled and does not set out the competing view, so we have described the dispute from both sides rather than from this page alone.
https://giraffeconservation.org/giraffe-species/Wikipedia — South Luangwa National Park (article and wikitext)
Read 28 September 2026, including the raw wikitext. Relevant because it is where most repetitions of the leopard-density claim ultimately lead. Its Nsefu Sector section states that the area "supports some of the highest recorded densities of leopards in southern Africa" and hangs that on two references. We could not verify either: the first, given as Thirgood et al., "The Dynamics of Wildlife in South Luangwa National Park", African Journal of Ecology 45.4 (2007): 676-685, returns nothing in Crossref, and Crossref's own index of that journal issue contains no article by those authors at those pages. The second is a 2012 Zambian Carnivore Programme report for which we found no public copy. The article's founding dates — a 1904 game reserve and a 1938 one — both carry citation-needed tags.
https://en.wikipedia.org/wiki/South_Luangwa_National_ParkEverything else, and what we can and cannot count
The park is credited with more than 60 mammal species and over 400 birds, of which 39 are birds of prey and 47 are summer migrants. Those are the figures zambiatourism.com publishes and we have found no departmental count to set against them — DNPW's own 2025 brochure, which might well contain one, is in the directory that returns 403.
What we can say about the headline species, and on what basis
| Species | What we can source | What we cannot |
|---|---|---|
| Leopard | 8.50 per 100 km2 inside the park, CI 7.52-9.48, 2012-2014 | A population total for the park; a current figure; a continental ranking |
| Lion | The 2016 study ran concurrent lion work and used its spatial data to rule out interspecific competition as the driver of the leopard pattern | Any lion density or population figure for South Luangwa |
| Impala, puku, zebra, warthog | Measured across the protection gradient, 4.5 to 13.2 times denser inside the park | Absolute densities in a form we would publish as a visitor-facing number |
| Elephant | Present and a headline species in every account of the park | Any survey count. We found no aerial survey figure for South Luangwa we could read |
| Hippo and crocodile | Concentrated in the river and the lagoons; visible from a boat in the wet season | Any count. The often-repeated Luangwa hippo figures trace to no source we could verify |
| African wild dog | Named on this site's species list for the park and present in the valley | A pack count or a density |
| Thornicroft's / Luangwa giraffe | 764, from the Giraffe Conservation Foundation | An independent count, or a date for that one |
Six of the seven rows have an empty right-hand column for the same reason: the authority that would publish these numbers has its document library behind a broken permission.
The hippo figure we are deliberately not giving you
You will read that the Luangwa holds the highest concentration of hippo in the world, usually with a number of animals per kilometre attached. We could not trace that figure to a survey, a department or a paper. It may well be true. It is not ours to print.
zambiatourism.com — South Luangwa National Park
Read 28 September 2026, along with its activities and accommodation pages. A large and long-standing Zambian travel portal, and the source here for the 9,050 square kilometre area, the 1972 founding, the "60 different animal species and over 400 different bird species" line, the camp list and the statement that on a walk "a qualified walking guide and armed ranger will accompany you". We checked who publishes it and could not establish that: the site carries no ownership or publisher statement, and the only attribution in its footer is to the agency that built it. Treat it as a well-informed trade source rather than an authority, which is how it is labelled everywhere it appears on these pages.
https://www.zambiatourism.com/destinations/national-parks/south-luangwa-national-park/Department of National Parks and Wildlife — "Park Entry Fees 2025" (attachment 4575, published 27 June 2025)
Attempted 28 September 2026 and refused. The document exists: DNPW's own media library, queried through the WordPress REST route on the departmental sub-site, returns it as attachment id 4575, mime type application/pdf, title "Park Entry Fees 2025", dated 27 June 2025. The file itself returns HTTP 403 Forbidden — to a plain request, to a browser user agent, with a referer from the department's own home page, over HTTP and over HTTPS alike. So does the "Department of National Parks & Wildlife — Brochure 2025" uploaded the same day, and so does every other file under that directory including the department's own 32-pixel logo. There is no copy in the Internet Archive. We could not read this document and we will not print a figure in its place.
https://www.mot.gov.zm/dnpw/wp-content/uploads/2025/06/Park-Entry-Fees-2025.pdfThe park as a research subject, which is unusual and useful
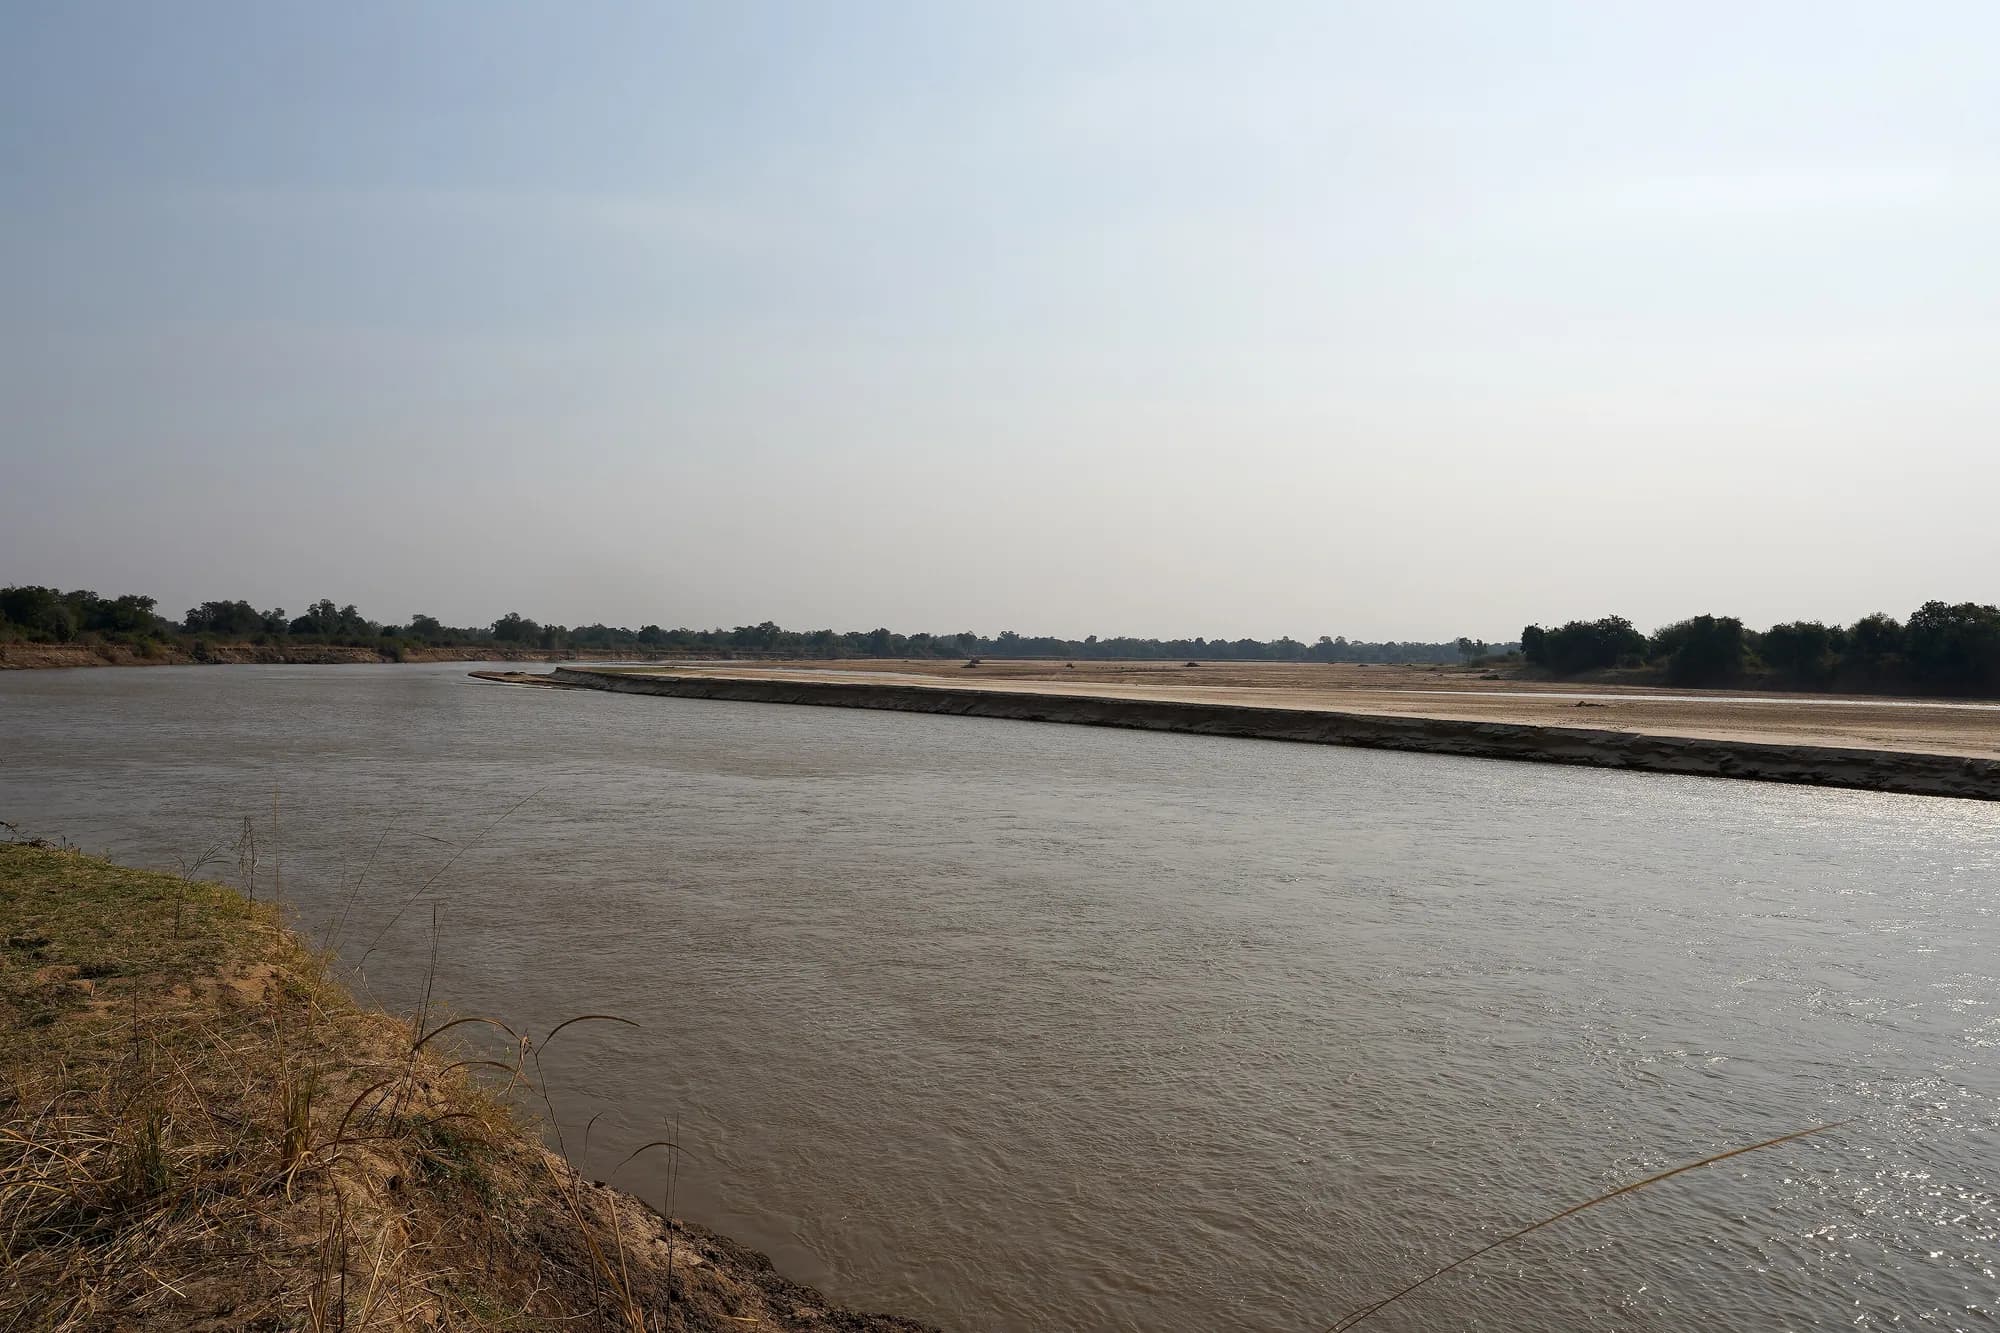
South Luangwa is one of the better-studied protected areas in Zambia, and the studies share a design: they compare the National Park against the Game Management Area beside it, because the two sit on the same river with the same vegetation and differ chiefly in how they are governed. That is a natural experiment, and it is the reason this park can tell a visitor things that most parks cannot.
- Leopards are 67 per cent denser inside the park than on the adjoining grid, and their survival rate is the same in both. Protection here works through prey, not through stopping people shooting leopards.
- All four common ungulates are between 4.5 and 13.2 times denser inside the park. That is the mechanism the leopard result rests on.
- Snare occurrence is 5.2 times higher on the buffer side. That is the mechanism the ungulate result rests on.
- Legal trophy hunting operated in Lupande GMA until a moratorium ran from January 2013 to April 2015, and the leopard study notes that Luangwa Valley leopard quotas were high relative to the rest of Zambia.
- A statutory instrument on lion and leopard trophy hunting was gazetted as recently as 27 March 2026, so this is a live policy area rather than a historical one.
What it means for what you will see
Nothing about the drives, and everything about where a camp puts you. A visitor who understands the gradient understands why a morning inside the park is not interchangeable with an afternoon in the GMA, why conservation levies on a Luangwa bill are not window dressing, and why the anti-snaring work that camps here fund is the specific intervention this specific landscape needs.
Rosenblatt, Creel, Becker, Merkle, Mwape, Schuette and Simpamba — "Effects of a protection gradient on carnivore density and survival: an example with leopards in the Luangwa valley, Zambia", Ecology and Evolution 6(11): 3772-3785 (5 May 2016)
Read 28 September 2026, in full, from the PubMed Central copy. Open access, peer reviewed, and co-authored with an officer of Zambia's own department. Camera traps on two matched grids either side of the Luangwa River across five dry seasons from 2012 to 2014, analysed with closed robust-design capture-recapture. It is the only rigorous leopard density estimate for this park that we could find, and the paper says as much about itself: these are "the first methodologically and statistically rigorous estimates of leopard density and survival" in the population. It is also the source for the park's area as the researchers state it (9,050 km2), the Lupande GMA area (5,660 km2) and the snare-occurrence comparison.
https://pmc.ncbi.nlm.nih.gov/articles/PMC4864144/Zambia Government Gazette, via the Gazettes.Africa archive (Laws.Africa)
Searched 28 September 2026. The archive holds Zambian gazettes from 2009 to 2026 — 157 issues for 2025 alone — with the full text indexed, and it does carry statutory instruments: Gazette No. 7893 of 27 March 2026 contains Statutory Instrument No. 19 of 2026, the Zambia Wildlife (Lion and Leopard Trophy Hunting) Regulations, across pages 38 to 42, and Statutory Instrument No. 20 of 2026 on international trade in endangered species. We searched it for a national park entry tariff under every phrasing we could think of — "park entry fees", "entry fee", "conservation fee", "Zambia Wildlife (Fees)" — and found none. Thirty-eight Zambian notices cite the Zambia Wildlife Act; the ones we read are forfeitures of seized property and appointments of honorary wildlife police officers. The archive is not the Zambian state's own publication channel and its coverage may be incomplete, so this is an absence of evidence, not proof that no instrument exists.
https://gazettes.africa/gazettes/zm